
ing-theme-matplotlib




ing_theme_matplotlib is a python package with a light and a dark matplotlib and seaborn style that allows you to create your plots using ING colors and ING Me font. It was adapted from the qbstyles package.
| Dark style | Light style |
|---|---|
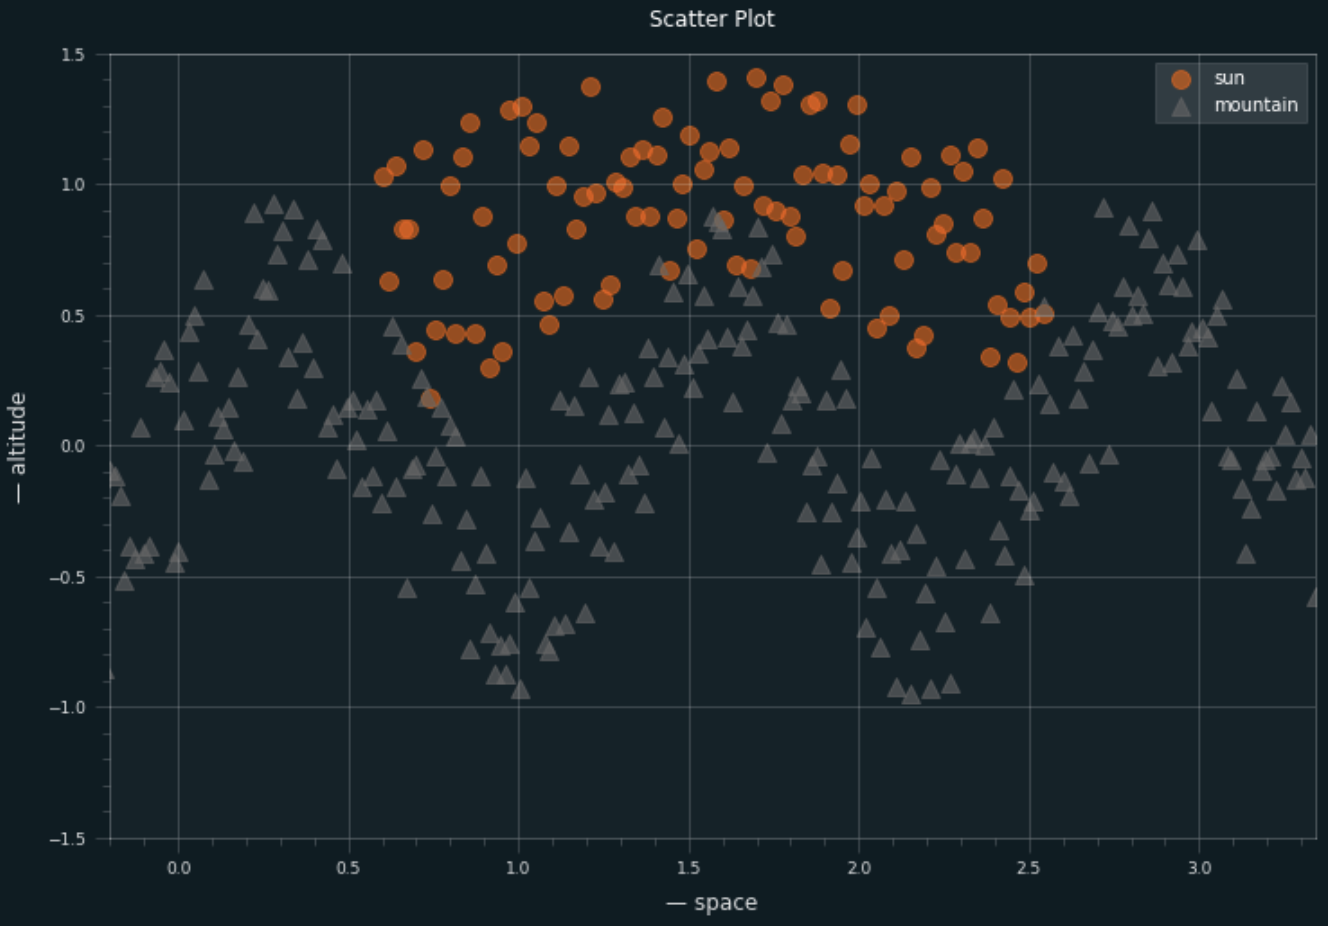 |
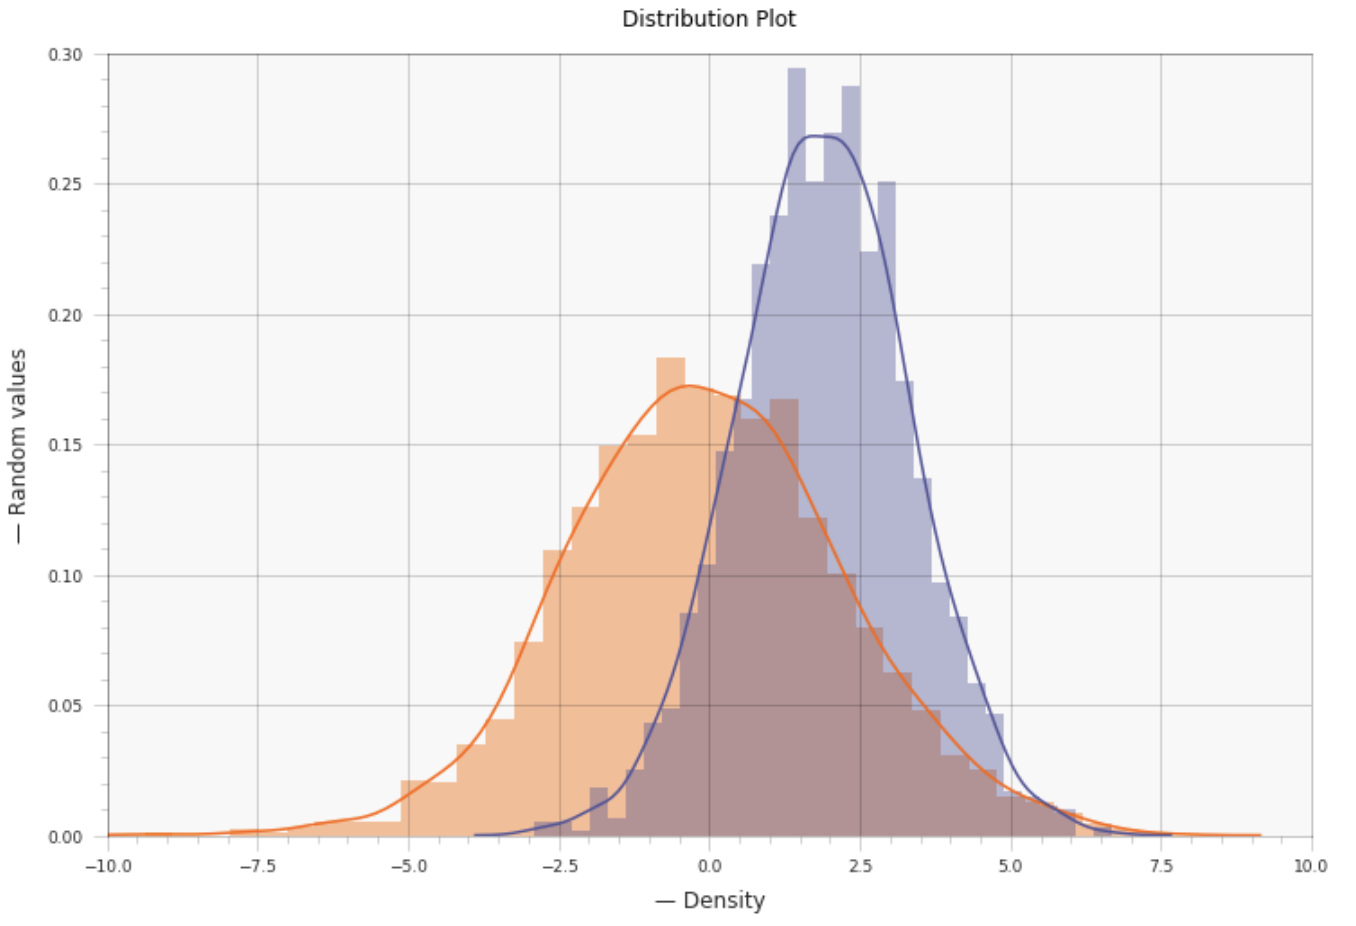 |
Installation
pip install ing_theme_matplotlib
Usage
You can use the dark Matplotlib style theme in the following way:
from ing_theme_matplotlib import mpl_style
mpl_style(dark=True)
And to use the light Matplotlib style theme, you can do the following:
from ing_theme_matplotlib import mpl_style
mpl_style(dark=False)
⚠️ Make sure to run
from ing_theme_matplotlib import mpl_styleandmpl_style()in different cells as shown above. See this issue.
Adding ING Logo
Assume that below is the function we use for plotting;
def line_plot(ax):
    rng = np.random.RandomState(4)
    x = np.linspace(0, 10, 500)
    y = np.cumsum(rng.randn(500, 4), 0)
    ax.set_title('Line Graph')
    ax.set_xlabel('— Time')
    ax.set_ylabel('— Random values')
    ax.plot(x, y, label = ['Bitcoin', 'Ethereum', 'Dollar', 'Oil'])
    ax.legend(['Bitcoin', 'Ethereum', 'Dollar', 'Oil'], loc = 1, fontsize = 'medium')
    ax.set_xlim([0, 10])
    ax.set_ylim([-20, 60])
    ax.figure.set_figwidth(16)
    ax.figure.set_figheight(8)
    ax.spines['right'].set_position(('axes', 1.05))
    ax.spines['right'].set_color('none')
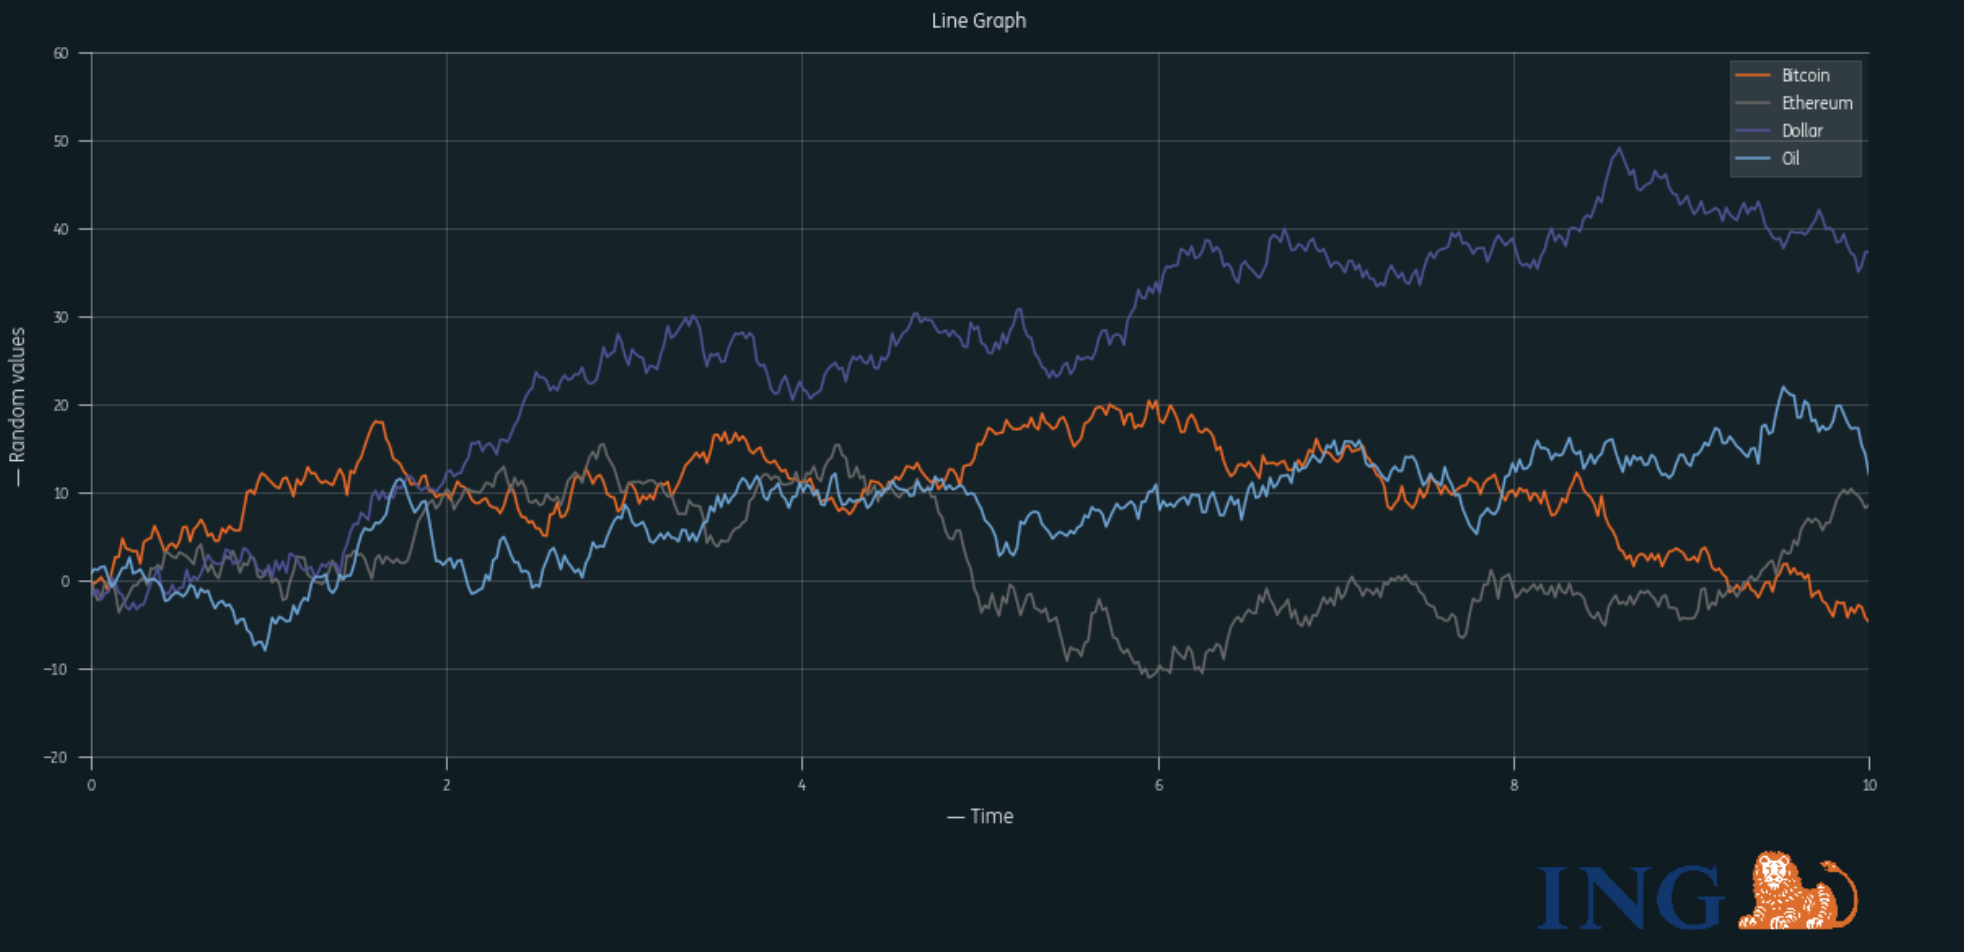
You can add the default ing logo to your plot by calling add_logo function inside the plotting function.
from ing_theme_matplotlib.mpl_style import add_logo
mpl_style()
line_plot(add_logo())
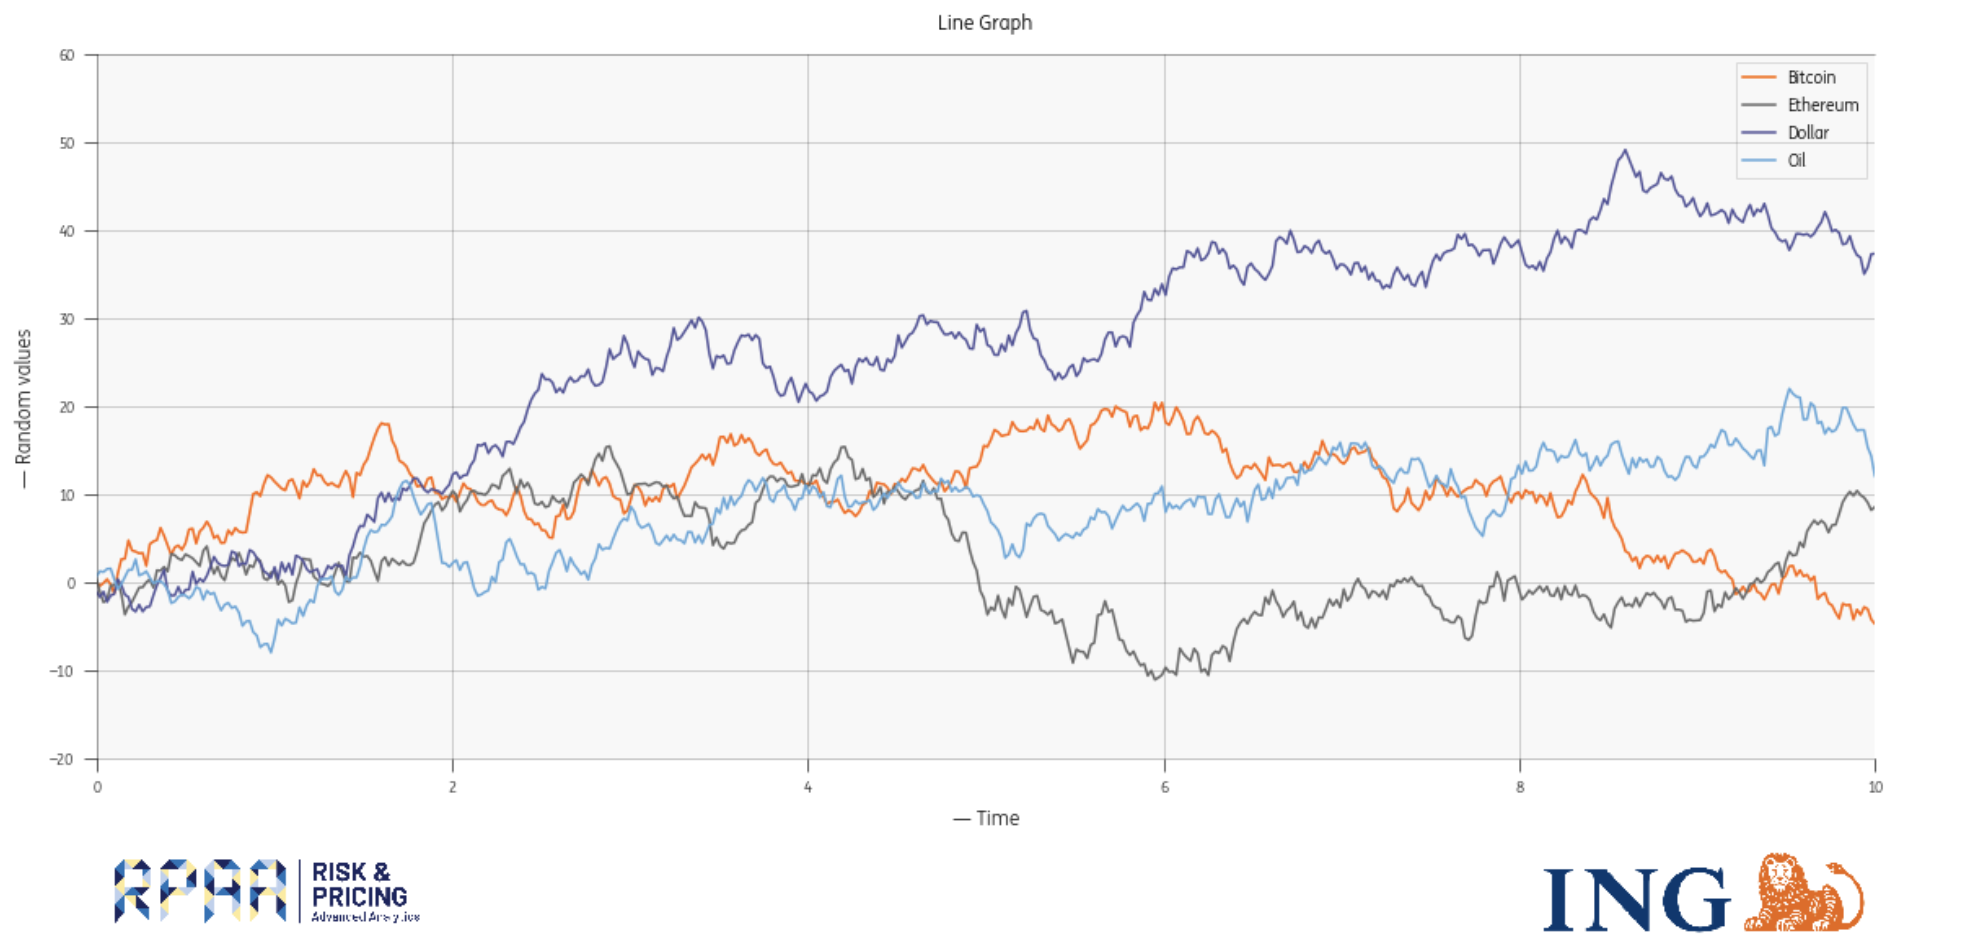
You can also add custom logos to your plot by giving the path where the image is located.
from ing_theme_matplotlib.mpl_style import add_logo
mpl_style(dark = False)
line_plot(add_logo(bottom_left = 'ing_theme_matplotlib/logos/RPAA_Logo_RGB_Line.png'))
For more examples see ExamplePlots.ipynb.
Seaborn Usage
Similar to above, you can implement plots in Seaborn. The main difference is how the logo is added.
mpl_style(dark = False)
def bar_plot():
    logo = add_logo()
    tips = sns.load_dataset("tips")
    ax = sns.barplot(x="tip", y="day", data=tips, ax=logo.axes)

bar_plot()
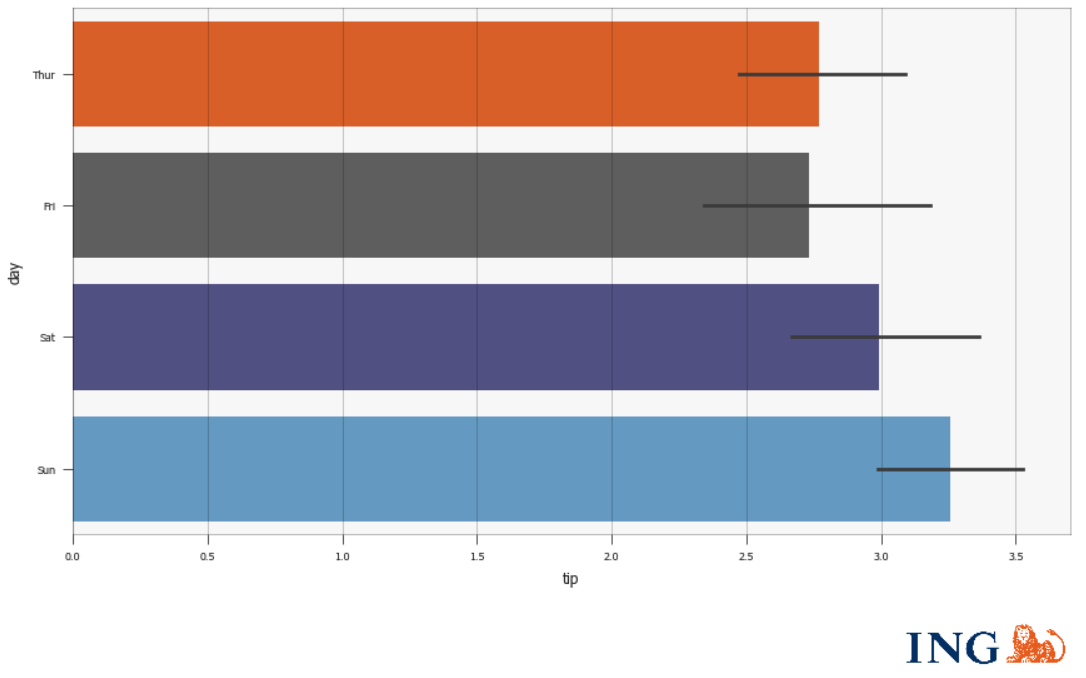
For more examples see [Example Seaborn Plots.ipynb](Example Seaborn Plots.ipynb).
Supported chart types
- Line plots
- Scatter plots
- Bubble plots
- Bar charts
- Pie charts
- Histograms and distribution plots
- 3D surface plots
- Stream plots
- Polar plots
plt.Figure()
It is important to note that we use plt.Figure_ING() in place of plt.Figure() due to changes in Matplotlib version 3.4.1.
As plt.subplots() works smoothly, it is best to stick to that methodology.
What licence do we use?
ING Style plotting is licensed under the Apache 2.0 License.
ing-theme-matplotlib is forked from qbstyles.
1 maintainer

Metadata
1 maintainer
Release files for ing-theme-matplotlib 0.1.8
For a detailed explanation of source distributions (sdists) and built distributions (wheels), please see the package formats documentation.
Source distribution (sdist)
| File | Size | Uploaded | |
|---|---|---|---|
| ing_theme_matplotlib-0.1.8.tar.gz | 152.5 kB | Details |
Release files / ing_theme_matplotlib-0.1.8.tar.gz
| Download URL | ing_theme_matplotlib-0.1.8.tar.gz |
|---|---|
| Size | 152.5 kB |
| Tags | Source |
|
SHA-256 checksum How to use checksums |
d8fe7d19572d61252fa4eeea936a1e1872a7f463e55575b2376d37a6c26d6be5
|
|
BLAKE2b-256 checksum How to use checksums |
9ac1ff21d921d585e0be199f1b8dfb4e75a82fb612b079320422fe8359390f49
|
| Upload date | |
|
Uploaded using Trusted Publishing? What is trusted publishing? |
No |
| Uploaded via |
twine/3.4.2 importlib_metadata/4.6.4 pkginfo/1.7.1 requests/2.25.1 requests-toolbelt/0.9.1 tqdm/4.61.2 CPython/3.9.5
|














