interpretable:

Project description


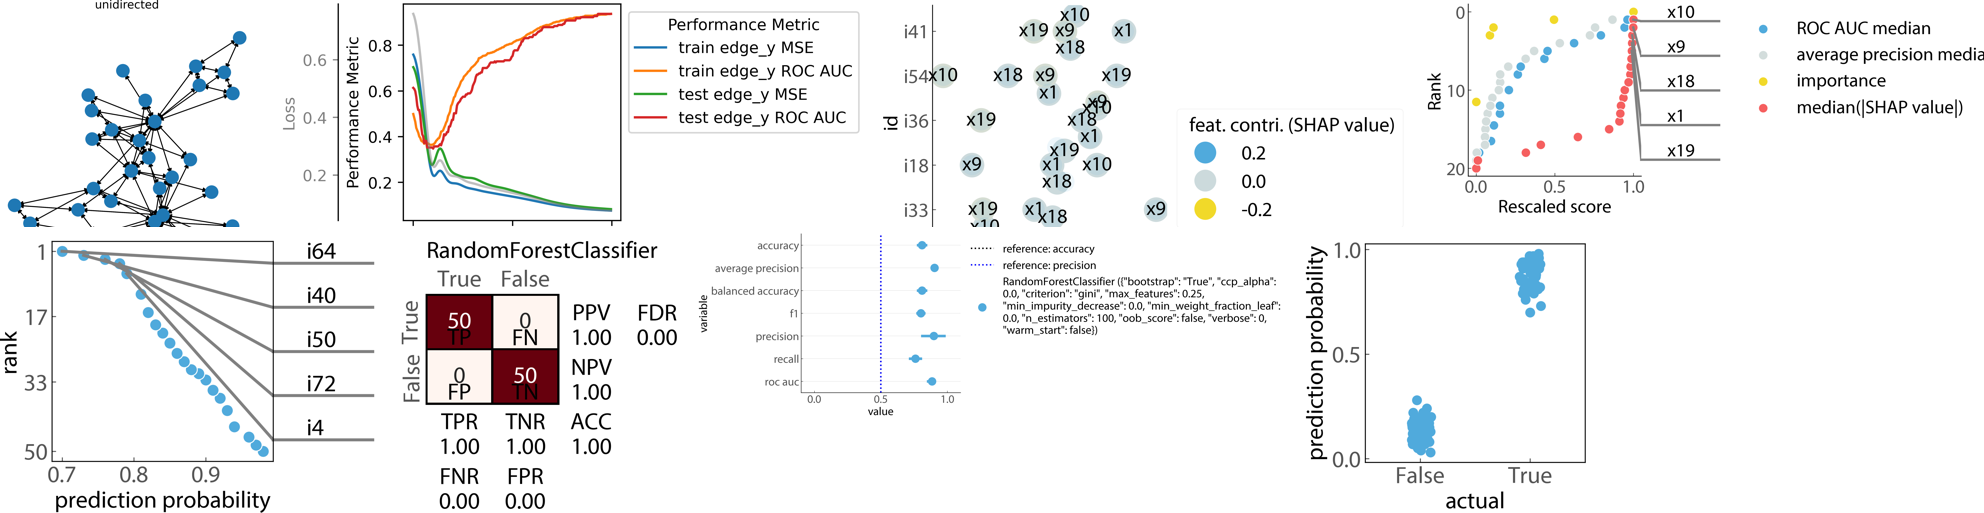
Examples
🕸️ Graph Neural Network based auto-encoder
🛠️ Preprocessing.
📦 Learning.
🧪 Evaluation.
🔢 Interpretation.
Installation
pip install interpretable # with basic dependencies
With additional dependencies as required:
pip install interpretable[ml]          # for machine learning applications using scikit-learn
pip install interpretable[dl]          # for deep learning based applications using pytorch
pip install interpretable[gnn]         # for graph neural network based applications using pytorch geometric
pip install interpretable[dev]         # for local testing
How to cite?
Please cite it using the metadata given in this file. For more information about citation, please see 'Cite this repository' section on the github page of the repository.
Future directions, for which contributions are welcome:
- Support for classification models other than RFC and GBC.
- Support for regression models.
- More examples of GNNs.
Similar projects:
API

module interpretable.gnn.layers
function get_channels
get_channels(start, end, scale, kind)
function get_layers
get_layers(
    model_name,
    num_node_features,
    hidden_channels,
    kind,
    scale,
    **kws_model
)
Get the layers for encoding or decoding.
function get_coder
get_coder(
    model_name,
    num_node_features,
    hidden_channels,
    kind,
    scale,
    **kws_model
)
Get a stack of layers for encoding or decoding
module interpretable.gnn
module interpretable.ml.classify
For classification.
function get_grid_search
get_grid_search(
    modeln: str,
    X: <built-in function array>,
    y: <built-in function array>,
    param_grid: dict = {},
    cv: int = 5,
    n_jobs: int = 6,
    random_state: int = None,
    scoring: str = 'balanced_accuracy',
    **kws
) → object
Grid search.
Args:
modeln(str): name of the model.X(np.array): X matrix.y(np.array): y vector.param_grid(dict, optional): parameter grid. Defaults to {}.cv(int, optional): cross-validations. Defaults to 5.n_jobs(int, optional): number of cores. Defaults to 6.random_state(int, optional): random state. Defaults to None.scoring(str, optional): scoring system. Defaults to 'balanced_accuracy'.
Keyword arguments:
kws: parameters provided to theGridSearchCVfunction.
Returns:
object:grid_search.
References:
1. https: //scikit-learn.org/stable/modules/generated/sklearn.model_selection.GridSearchCV.html2. https: //scikit-learn.org/stable/modules/model_evaluation.html
function get_estimatorn2grid_search
get_estimatorn2grid_search(
    estimatorn2param_grid: dict,
    X: DataFrame,
    y: Series,
    **kws
) → dict
Estimator-wise grid search.
Args:
estimatorn2param_grid(dict): estimator name to the grid search map.X(pd.DataFrame): X matrix.y(pd.Series): y vector.
Returns:
dict: output.
function get_test_scores
get_test_scores(d1: dict) → DataFrame
Test scores.
Args:
d1(dict): dictionary with objects.
Returns:
pd.DataFrame: output.
TODOs: Get best param index.
function run_grid_search
run_grid_search(
    df,
    cols_x,
    coly,
    colindex,
    n_estimators: int = None,
    qcut: float = None,
    evaluations: list = ['prediction', 'feature importances', 'partial dependence'],
    estimatorn2param_grid: dict = None,
    output_dir_path: str = None,
    test: bool = False,
    **kws
) → dict
Run grid search.
Args:
n_estimators(int): number of estimators.qcut(float, optional): quantile cut-off. Defaults to None.evaluations(list, optional): evaluations types. Defaults to ['prediction','feature importances', 'partial dependence', ].estimatorn2param_grid(dict, optional): estimator to the parameter grid map. Defaults to None.output_dir_path(str, optional): output_dir_pathut path. Defaults to None.test(bool, optional): test mode. Defaults to False.
Keyword arguments:
kws: parameters provided toget_estimatorn2grid_search.
Returns:
dict: estimator to grid search map.
module interpretable.ml.evaluate
function get_probability
get_probability(
    estimatorn2grid_search: dict,
    X: <built-in function array>,
    y: <built-in function array>,
    colindex: str,
    coff: float = 0.5,
    test: bool = False
) → DataFrame
Classification probability.
Args:
estimatorn2grid_search(dict): estimator to the grid search map.X(np.array): X matrix.y(np.array): y vector.colindex(str): index column.coff(float, optional): cut-off. Defaults to 0.5.test(bool, optional): test mode. Defaults to False.
Returns:
pd.DataFrame: output.
function get_auc_cv
get_auc_cv(estimator, X, y, cv=5, test=False, fitted=False, random_state=None)
TODO: just predict_probs as inputs TODO: resolve duplication of stat.binary.auc TODO: add more metrics in ds1 in addition to auc
function get_roc_auc
get_roc_auc(true, test, outmore=False)
module interpretable.ml.interpret
function get_feature_predictive_power
get_feature_predictive_power(
    d0: dict,
    df01: DataFrame,
    n_splits: int = 5,
    n_repeats: int = 10,
    random_state: int = None,
    plot: bool = False,
    drop_na: bool = False,
    **kws
) → DataFrame
get_feature_predictive_power summary
Notes:
x-values should be scale and sign agnostic.
Args:
d0(dict): input dictionary.df01(pd.DataFrame): input data,n_splits(int, optional): number of splits. Defaults to 5.n_repeats(int, optional): number of repeats. Defaults to 10.random_state(int, optional): random state. Defaults to None.plot(bool, optional): plot. Defaults to False.drop_na(bool, optional): drop missing values. Defaults to False.
Returns:
pd.DataFrame: output data.
function get_feature_importances
get_feature_importances(
    estimatorn2grid_search: dict,
    X: DataFrame,
    y: Series,
    scoring: str = 'roc_auc',
    n_repeats: int = 20,
    n_jobs: int = 6,
    random_state: int = None,
    plot: bool = False,
    test: bool = False,
    **kws
) → DataFrame
Feature importances.
Args:
estimatorn2grid_search(dict): map between estimator name and grid search object.X(pd.DataFrame): X matrix.y(pd.Series): y vector.scoring(str, optional): scoring type. Defaults to 'roc_auc'.n_repeats(int, optional): number of repeats. Defaults to 20.n_jobs(int, optional): number of cores. Defaults to 6.random_state(int, optional): random state. Defaults to None.plot(bool, optional): plot. Defaults to False.test(bool, optional): test mode. Defaults to False.
Returns:
pd.DataFrame: output data.
function get_partial_dependence
get_partial_dependence(
    estimatorn2grid_search: dict,
    X: DataFrame,
    y: Series,
    test: bool = False
) → DataFrame
Partial dependence.
Args:
estimatorn2grid_search(dict): map between estimator name and grid search object.X(pd.DataFrame): X matrix.y(pd.Series): y vector.
Returns:
pd.DataFrame: output data.
function interpret
interpret(
    input_dir_path,
    output_dir_path,
    keys=['predictive power', 'feature importances', 'partial dependence', 'feature contributions'],
    random_state=None,
    plot=False,
    test=False
)
function agg_predictive_power
agg_predictive_power(df)
function agg_feature_importances
agg_feature_importances(df)
function agg_feature_contributions
agg_feature_contributions(df4)
function agg_feature_interpretations
agg_feature_interpretations(interprets: dict)
module interpretable.ml.io
function read_models
read_models(
    output_dir_path,
    keys=None,
    filenames={'inputs': 'input.json', 'data': 'input.pqt', 'estimators': 'estimatorn2grid_search.pickle', 'predictions': 'prediction.pqt'}
)
module interpretable.ml
module interpretable.ml.pre
function get_Xy
get_Xy(df01, columns, y_kind)
Get the columns for a kind of model
function get_Xy_for_classification
get_Xy_for_classification(
    df1: DataFrame,
    coly: str,
    qcut: float = None,
    drop_xs_low_complexity: bool = False,
    min_nunique: int = 5,
    max_inflation: float = 0.5,
    **kws
) → dict
Get X matrix and y vector.
Args:
df1(pd.DataFrame): input data, should be indexed.coly(str): column with y values, bool if qcut is None else float/intqcut(float, optional): quantile cut-off. Defaults to None.drop_xs_low_complexity(bool, optional): to drop columns with <5 unique values. Defaults to False.min_nunique(int, optional): minimum unique values in the column. Defaults to 5.max_inflation(float, optional): maximum inflation. Defaults to 0.5.
Keyword arguments:
kws: parameters provided todrop_low_complexity.
Returns:
dict: output.
module interpretable.viz.annot
function annot_confusion_matrix
annot_confusion_matrix(df_: DataFrame, ax: Axes = None, off: float = 0.5) → Axes
Annotate a confusion matrix.
Args:
df_(pd.DataFrame): input data.ax(plt.Axes, optional):plt.Axesobject. Defaults to None.off(float, optional): offset. Defaults to 0.5.
Returns:
plt.Axes:plt.Axesobject.
module interpretable.viz.gnn
function lines_metricsby_epochs
lines_metricsby_epochs(data, figsize=[3, 3])
Args:
data: table containing the epoch and other metrics.
module interpretable.viz
module interpretable.viz.ml
function plot_metrics
plot_metrics(data, inputs, estimators, plot: bool = False) → DataFrame
Plot performance metrics.
Args:
plot(bool, optional): make plots. Defaults to False.
Returns:
pd.DataFrame: output data.
function plot_feature_predictive_power
plot_feature_predictive_power(
    df3: DataFrame,
    ax: Axes = None,
    figsize: list = [3, 3],
    **kws
) → Axes
Plot feature-wise predictive power.
Args:
df3(pd.DataFrame): input data.ax(plt.Axes, optional): axes object. Defaults to None.figsize(list, optional): figure size. Defaults to [3,3].
Returns:
plt.Axes: output.
function plot_feature_ranks
plot_feature_ranks(df2: DataFrame)
function plot_feature_contributions
plot_feature_contributions(data, kws_plot, vmax=0.2, vmin=-0.2, figsize=[4, 4])
Release history Release notifications | RSS feed


Download files
Download the file for your platform. If you're not sure which to choose, learn more about installing packages.
Source Distribution
File details
Details for the file interpretable-0.0.1.tar.gz.
File metadata
- Download URL: interpretable-0.0.1.tar.gz
- Upload date:
- Size: 37.3 kB
- Tags: Source
- Uploaded using Trusted Publishing? No
- Uploaded via: twine/4.0.2 CPython/3.7.12
File hashes
| Algorithm | Hash digest | |
|---|---|---|
| SHA256 |
0c0ac880d5d032b2b459a86ed5be7a82a653100ef6cccc8dd50cbef31d5f1f0b
|
|
| MD5 |
93de6c124060cd459629b3b7ab9c6fc2
|
|
| BLAKE2b-256 |
0fa313e1939299fb0b5ca9e43242f7885283938fca7e44bf3f8ffd749241cd1b
|


