Interactive Terminal Utilities
Project description
Interactive Terminal Utilities
import itrm
This library provides several functions for nicely printing data to the terminal. MatPlotLib is a very nice library, but it can be a bit tedious at times when all you want is something quick and dirty.
- Every separate plot needs to be introduced with a
plt.figure()statement. - Large sets of data can be slow to render.
- If you are working in full screen on the terminal, plots can pull you to another window.
- The entire python program and the terminal is locked up after any
plt.show()command until you close all figure windows. - Unless you save the figures to individual files, there is no buffer to show plots from past runs.
These are all excuses to use this library. But, the biggest reason to use this library is that the terminal is cool, and the more you can do your work in the terminal the better!
Plots
itrm.plot(x, y=None, label=None, rows=1, cols=1, equal=0, overlay=False):
The plot function will render all the data points defined by x and y to the
terminal. The inputs x and y can be vectors or matrices. If they are
matrices, each row is treated as a separate curve.
The shapes of x and y do not have to be the same, but they must be
compatible. So, x could be a vector and y could be a matrix as long as the
length of x equals the number of columns of y.
If only x is given, it will be interpreted as the y values, and the x
values will be the array of indices.
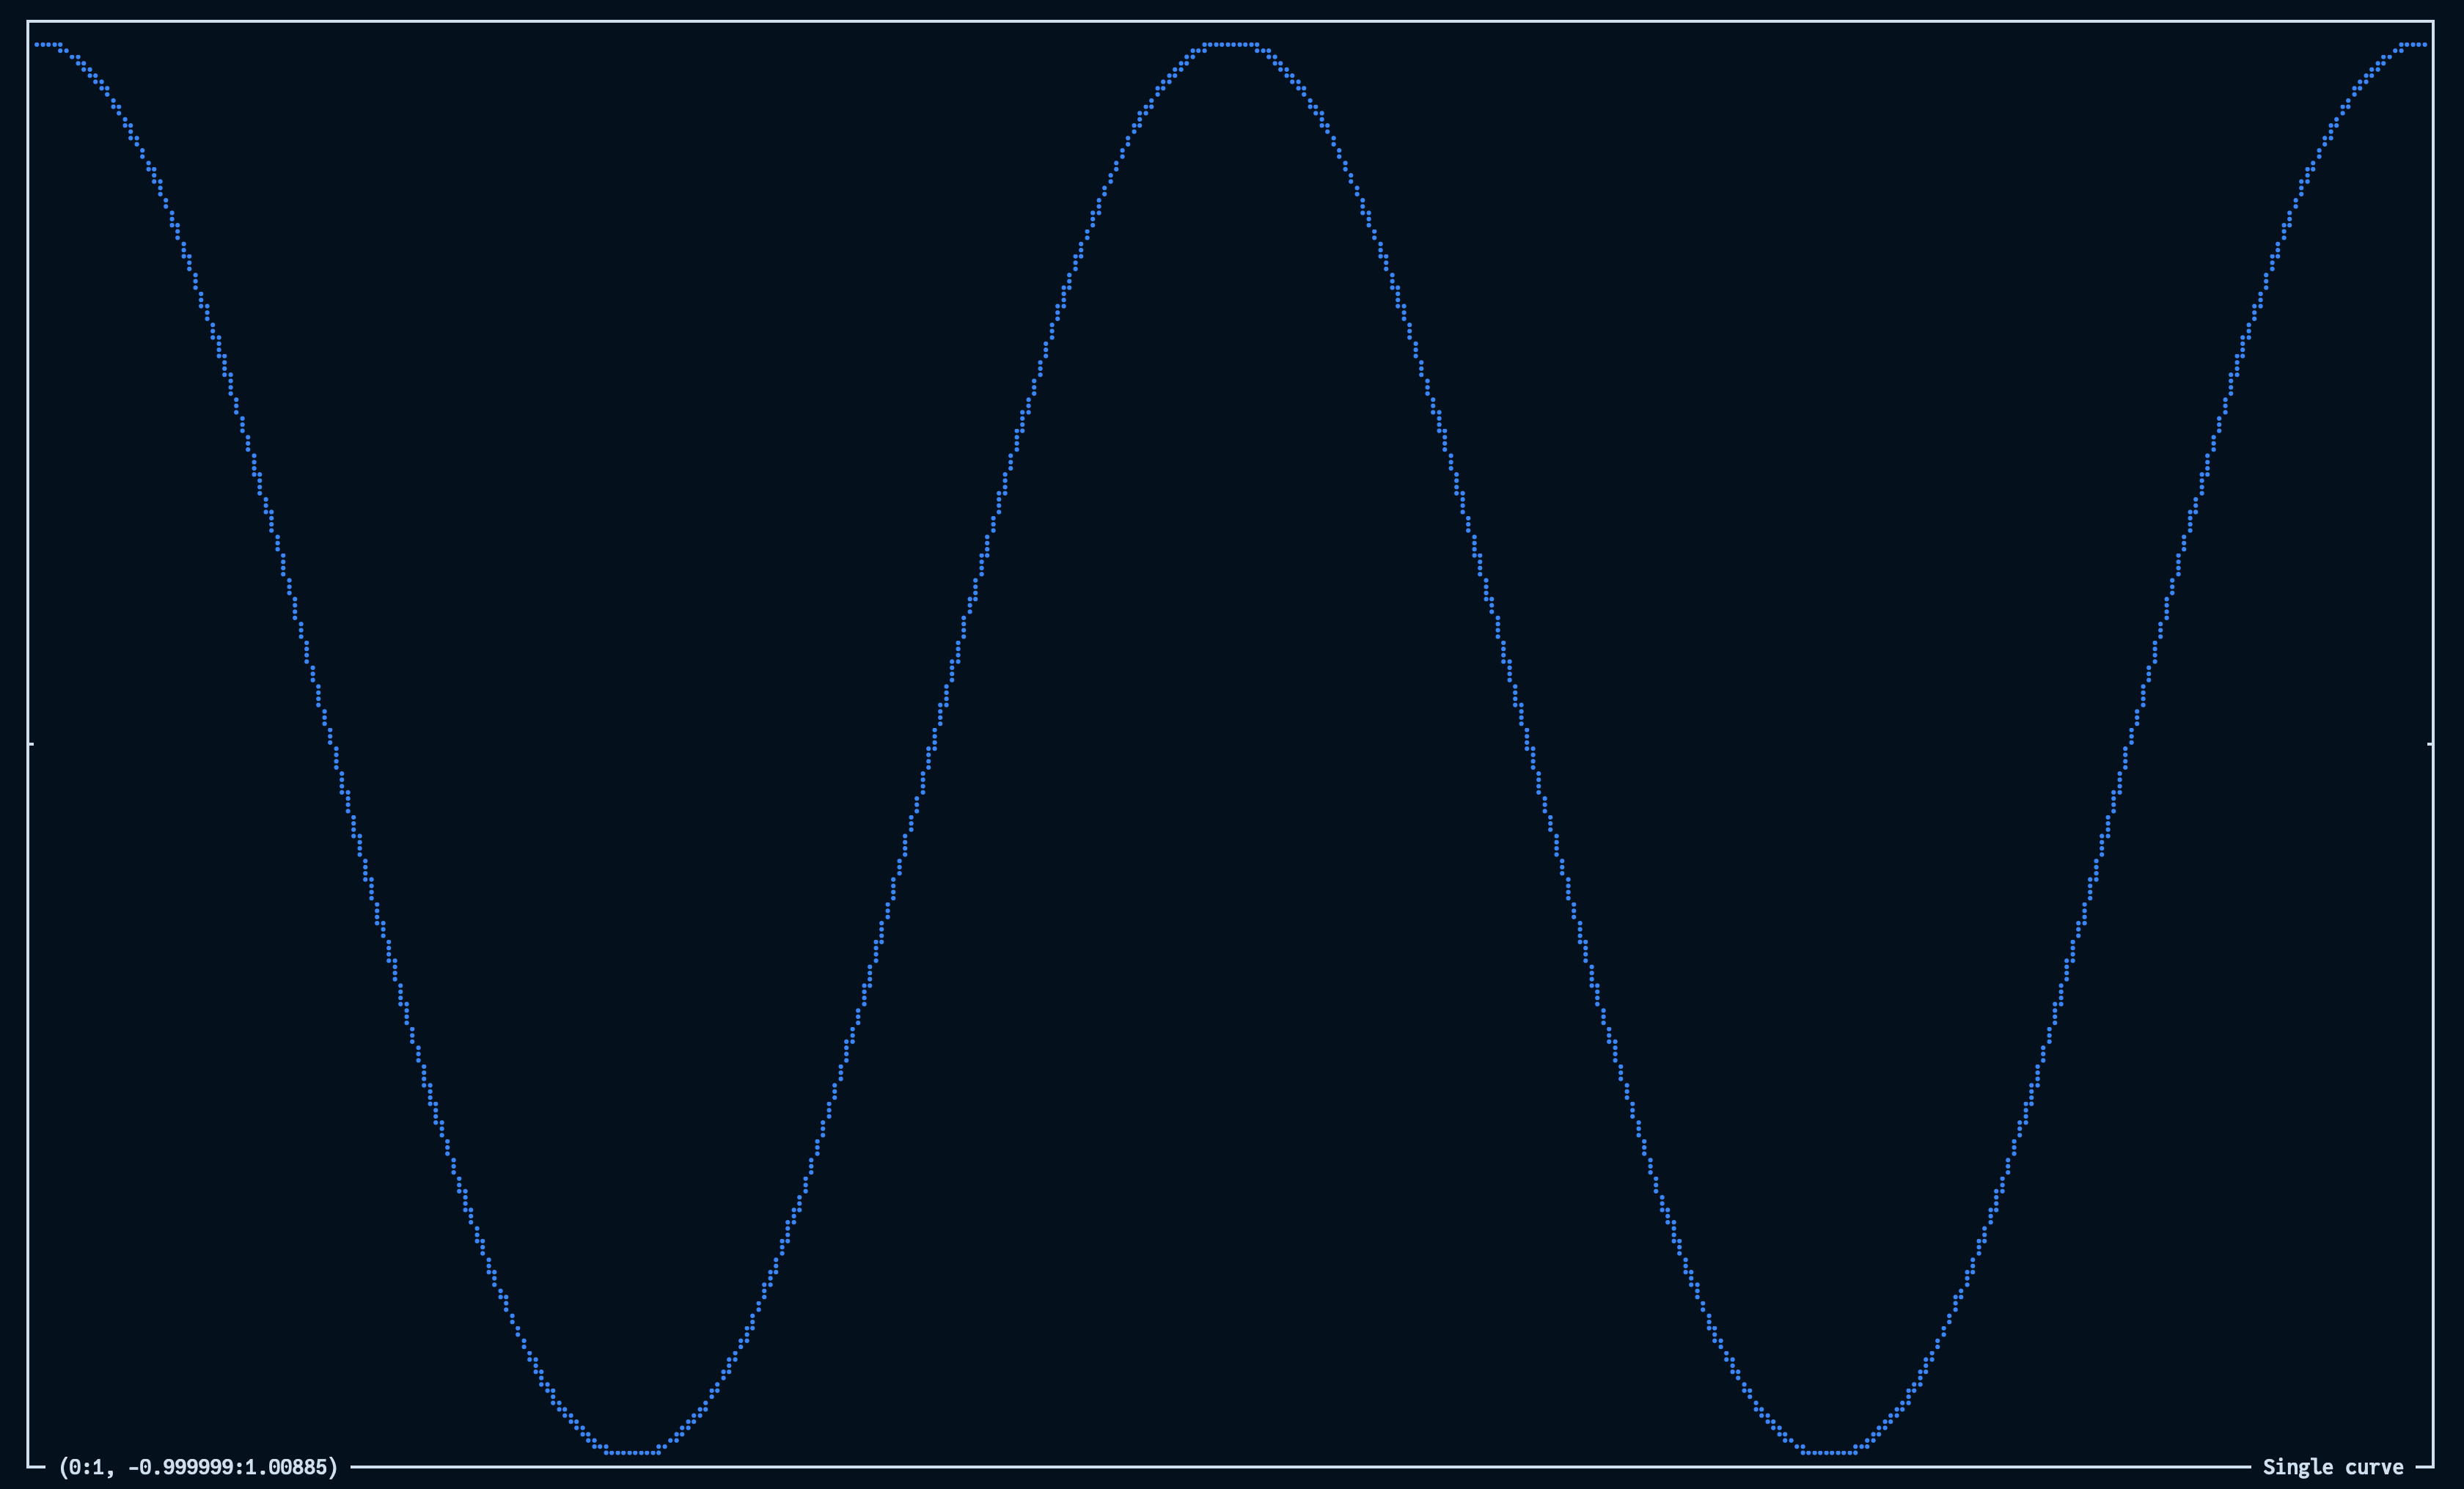
When the plot is printed, the graph is rendered within a box and the ranges of
x and y are listed in the bottom left corner. So,
(0:99, -1.5:1.5)
means that x ranges from 0 to 99 and y ranges from -1.5 to 1.5.
If a label is given, this will be printed in the bottom right of the plot box.
The rows and cols parameters let you specify the number of terminal text
rows and columns to use for the plot, respectively. For each of these, if the
value is less than or equal to 1, it represents a portion of the available space
to use. For example, if rows is 0.5, then half the number of rows of the
current terminal window will be used for the plot. If the value is greater than
1, it represents the absolute number of columns or rows to use. Also, if the
size of the current terminal cannot be obtained, the available space will
default to 20 rows and 60 columns. These defaults can be redefined by
changing itrm.config.rows and itrm.config.cols.
By default, this library will use Unicode symbols (specifically braille) for
plotting. A good font to use is JuliaMono. However, if your font does not
support the necessary Unicode symbols, you can tell the library to not use them
by setting itrm.config.uni to False before calling the itrm.plot function.
If only one curve is being plotted, the characters will be written in whatever the default font color is set to in your terminal. If more than one curve is plotted, color will be used. The color map is blue, green, yellow, orange, and magenta. If you have more than 5 curves (This is just a terminal-based plot; why would you do that?), then the colors will recycle.
If you want equal axis scaling, set equal to 1. However, since terminal
fonts are not always the same aspect ratio and because the line spacing in your
terminal might be adjustable, you can adjust this value to tune.
To prevent your terminal history from extending significantly, you can print a
new plot over a previous plot by setting the overlay parameter to True.
| Single curve | Multiple curves |
|---|---|
 |
 |
Interactive Plots
itrm.iplot(x, y=None, label=None, rows=1, cols=1, overlay=False):
The iplot function is nearly identical to the plot function, except that the
resulting plot will be interactive with a cursor you can move to inspect the
values. You can move the cursor left and right, at normal speed or fast speed.
You can zoom in and out. And, you can cycle through which rows of the x and
y data to focus on. Note, iplot is designed for monotonically-increasing x
values, and, consequently, does not support equal axis scaling.
The following table details the shortcut keys:
| Keys | Function | Keys | Function | |
|---|---|---|---|---|
q, x, ⌫, ↵ |
exit interactive plot | j, s, ↓ |
zoom in | |
h, a, ← |
move cursor left | k, w, ↑ |
zoom out | |
l, d, → |
move cursor right | J, S, ⇧↓ |
zoom in fast | |
H, A, ⇧← |
move cursor left fast | K, W, ⇧↑ |
zoom out fast | |
L, D, ⇧→ |
move cursor right fast | n |
next data row | |
g |
move cursor to start | p |
previous data row | |
G |
move cursor to end | i |
toggle individual view | |
c, z |
center view on cursor |
Bars
itrm.bars(x, labels=None, cols=1, fat=False)
It can be convenient to plot a simple bar graph. The x input is the vector of
values. The labels input is a list of strings corresponding to the labels to
print before the bar of each value in x. If the cols input is greater than
1, it is the total width of characters including the labels. If it is less than
or equal to 1, it is the portion of the terminal window width which will be used
for the graph. If the fat input is set to True, the bars will be thick.
 apples |=========                                         |
oranges |=========================================         |
bananas |==================================================|
  pears |====================                              |
 grapes |============================                      |
Heat maps
itrm.heat(matrix)
The heat function will generate a heat map of the matrix input using 24
shades of gray. Black is used for the lowest value and white for the highest
value. If itrm.config.uni is True, half-block characters from the Unicode
table will be used. If it is False, two spaces per element of the matrix will
be used.
| With Unicode | Without Unicode |
|---|---|
 |
 |
Tables
itrm.table(matrix, head=None, left=None, width=10, sep=' ')
You can print a nicely spaced table of the matrix data. The head and left
inputs are lists of header and left-most column labels, respectively, to print
around the matrix.
           |      Set 1       Set 2       Set 3
---------- | ----------  ----------  ----------
    apples | 0.65802165  0.20015677  0.51074794
   bananas | 0.42184098  0.46774988  0.39589918
     pears | 0.79159879  0.89324181  0.57347394
   oranges | 0.25932644  0.29973433  0.90646047
    grapes |  0.2751687  0.40117769  0.58233234
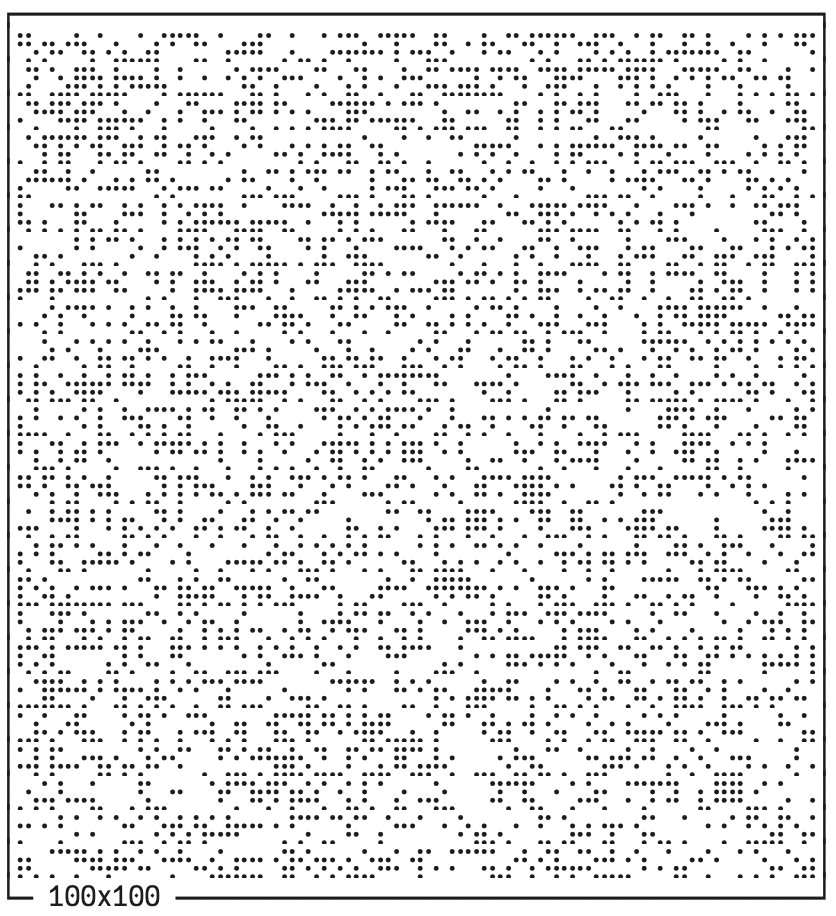
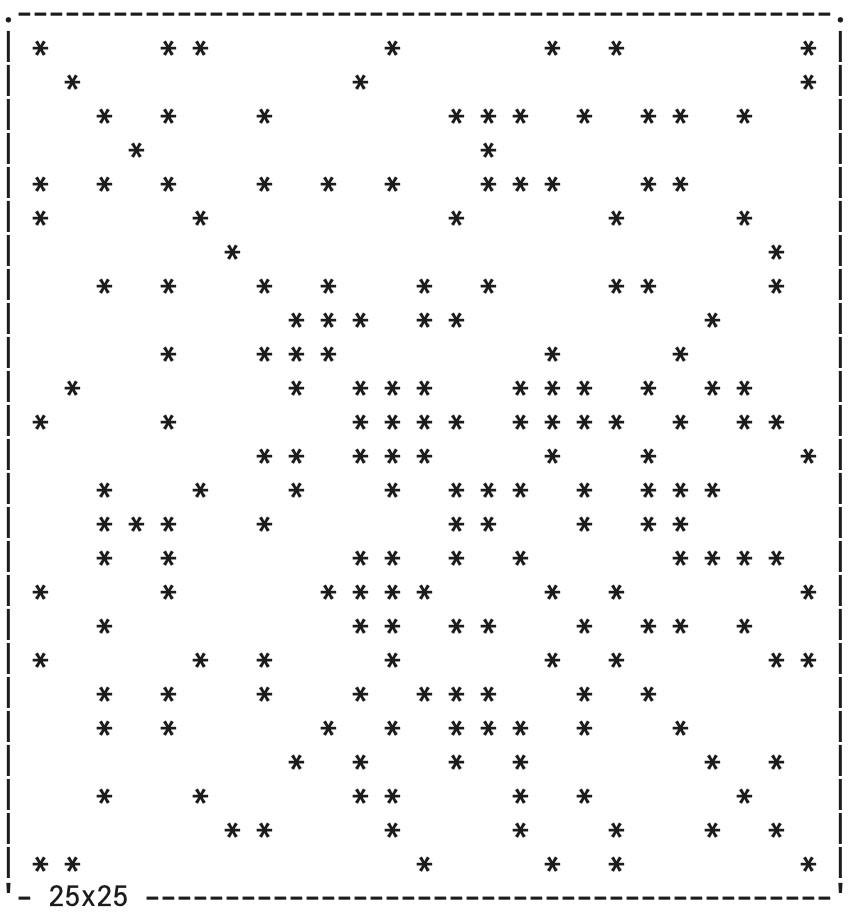
Sparsity
itrm.sparsity(matrix, label='')
If all you want to see is the sparsity of a matrix, use this function. The
label input will be placed in the bottom-right corner of the render.
| With Unicode | Without Unicode |
|---|---|
 |
 |
Progress bars
itrm.progress(k, K, t_init=None, cols=1, fat=False)
There are many progress bar libraries available for Python. But, many of them
seem to be extremely over-complicated. TQDM, for example, includes over 20
source files. This library's implementation of a progress bar is a single,
one-page function. The k input is the counter of whatever for loop the
progress bar is reporting on. The K input is one greater than the largest
possible value of k, as in for k in range(K):. If t_init is provided, the
estimated time remaining to complete the process based on the initial time
stored in t_init will be displayed. When the process is completed, the total
elapsed time since t_init will be displayed. If cols is not provided, the
full width of the current terminal window will be used. If the fat input is
set to True, the bars will be thick.
44% ======================----------------------------- -00:00:02.1
Project details
Release history Release notifications | RSS feed
Download files
Download the file for your platform. If you're not sure which to choose, learn more about installing packages.


