A configurable Qt widget that displays IV curves

Project description
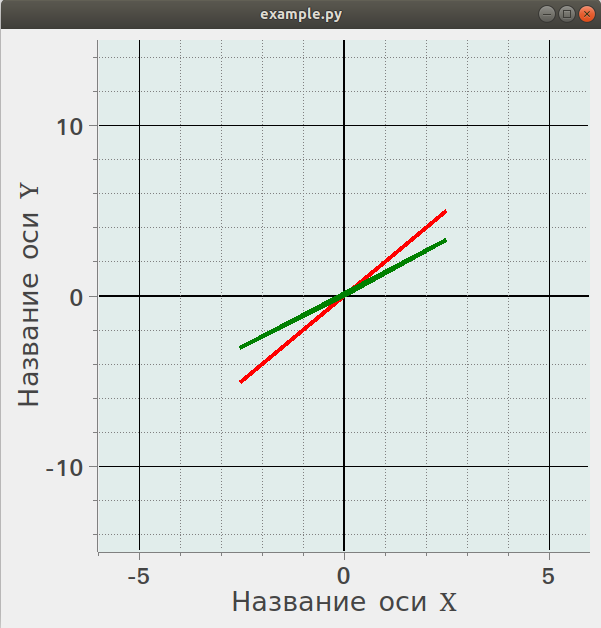
Модуль для просмотра ВАХ
Настраиваемый PyQt-виджет для отображения Вольт-Амперных Характеристик (ВАХ). Виджет умеет выводить несколько ВАХ на график и при необходимости обновлять их.
Установка
Установка возможна только на Python версии >=3.6 и <=3.8.
python -m pip install ivviewer
Проверка установки
python -m ivviewer # при успешной установке создаст окно с графиком
Пример использования
import sys
from PyQt5.QtGui import QColor
from PyQt5.QtWidgets import QApplication
import ivviewer

app = QApplication(sys.argv)
window = ivviewer.Viewer()
window.plot.set_x_axis_title("Название оси X")
window.plot.set_y_axis_title("Название оси Y")
window.plot.set_scale(6.0, 15.0)

x_test = [-2.5, 0, 2.5]
y_test = [-0.005, 0, 0.005]
test_curve = window.plot.add_curve()
test_curve.set_curve(ivviewer.Curve(x_test, y_test))
test_curve.set_curve_params(QColor("red"))

x_ref = [-2.5, 0, 2.5]
y_ref = [-0.003, 0, 0.0033]
reference_curve = window.plot.add_curve()
reference_curve.set_curve(ivviewer.Curve(x_ref, y_ref))
reference_curve.set_curve_params(QColor("green"))

window.resize(600, 600)
window.show()
app.exec()
Release history Release notifications | RSS feed


Download files
Download the file for your platform. If you're not sure which to choose, learn more about installing packages.
Source Distribution
ivviewer-1.0.1.tar.gz
(6.5 MB
view details)
Built Distribution
Filter files by name, interpreter, ABI, and platform.
If you're not sure about the file name format, learn more about wheel file names.
Copy a direct link to the current filters
ivviewer-1.0.1-py3-none-any.whl
(33.5 kB
view details)
File details
Details for the file ivviewer-1.0.1.tar.gz.
File metadata
- Download URL: ivviewer-1.0.1.tar.gz
- Upload date:
- Size: 6.5 MB
- Tags: Source
- Uploaded using Trusted Publishing? No
- Uploaded via: twine/3.8.0 pkginfo/1.9.6 readme-renderer/34.0 requests/2.27.1 requests-toolbelt/1.0.0 urllib3/1.26.18 tqdm/4.64.1 importlib-metadata/4.8.3 keyring/23.4.1 rfc3986/1.5.0 colorama/0.4.5 CPython/3.6.8
File hashes
| Algorithm | Hash digest | |
|---|---|---|
| SHA256 |
2a3dd995e8019c1c126fa99481cba1153dcba546b5dd944d62600cacc44e2f49
|
|
| MD5 |
311a3a4311e9ca74b990a9ccdbe59c59
|
|
| BLAKE2b-256 |
a38997a6dc88b0d41c2ff25fde1b255f60a8376a78f6dce89e191a6413738758
|
File details
Details for the file ivviewer-1.0.1-py3-none-any.whl.
File metadata
- Download URL: ivviewer-1.0.1-py3-none-any.whl
- Upload date:
- Size: 33.5 kB
- Tags: Python 3
- Uploaded using Trusted Publishing? No
- Uploaded via: twine/3.8.0 pkginfo/1.9.6 readme-renderer/34.0 requests/2.27.1 requests-toolbelt/1.0.0 urllib3/1.26.18 tqdm/4.64.1 importlib-metadata/4.8.3 keyring/23.4.1 rfc3986/1.5.0 colorama/0.4.5 CPython/3.6.8
File hashes
| Algorithm | Hash digest | |
|---|---|---|
| SHA256 |
1703ea2246bf5b7854caf608d315aa44bfcc8ea6b521e5d59a6c7a1688ef3954
|
|
| MD5 |
3ebd56718a16441c69edd7b3cece522b
|
|
| BLAKE2b-256 |
132023134042a1986299789b4051349a81ce762e884238699a3b96e13a2dfb19
|


