









https://github.com/wey-gu/jupyter_nebulagraph/assets/1651790/10135264-77b5-4d3c-b68f-c5810257feeb
jupyter_nebulagraph, formerly ipython-ngql, is a Python package that simplifies the process of connecting to NebulaGraph from Jupyter Notebooks or iPython environments. It enhances the user experience by streamlining the creation, debugging, and sharing of Jupyter Notebooks. With jupyter_nebulagraph, users can effortlessly connect to NebulaGraph, load data, execute queries, visualize results, and fine-tune query outputs, thereby boosting collaborative efforts and productivity.
Getting Started
pip install jupyter_nebulagraph
Load the extension in Jupyter Notebook or iPython:
%load_ext ngql
%ngql --address 127.0.0.1 --port 9669 --user root --password nebula
Make queries:
%ngql USE basketballplayer;
%ngql MATCH p=(v:player)-->(v2:player) WHERE id(v) == "player100" RETURN p;
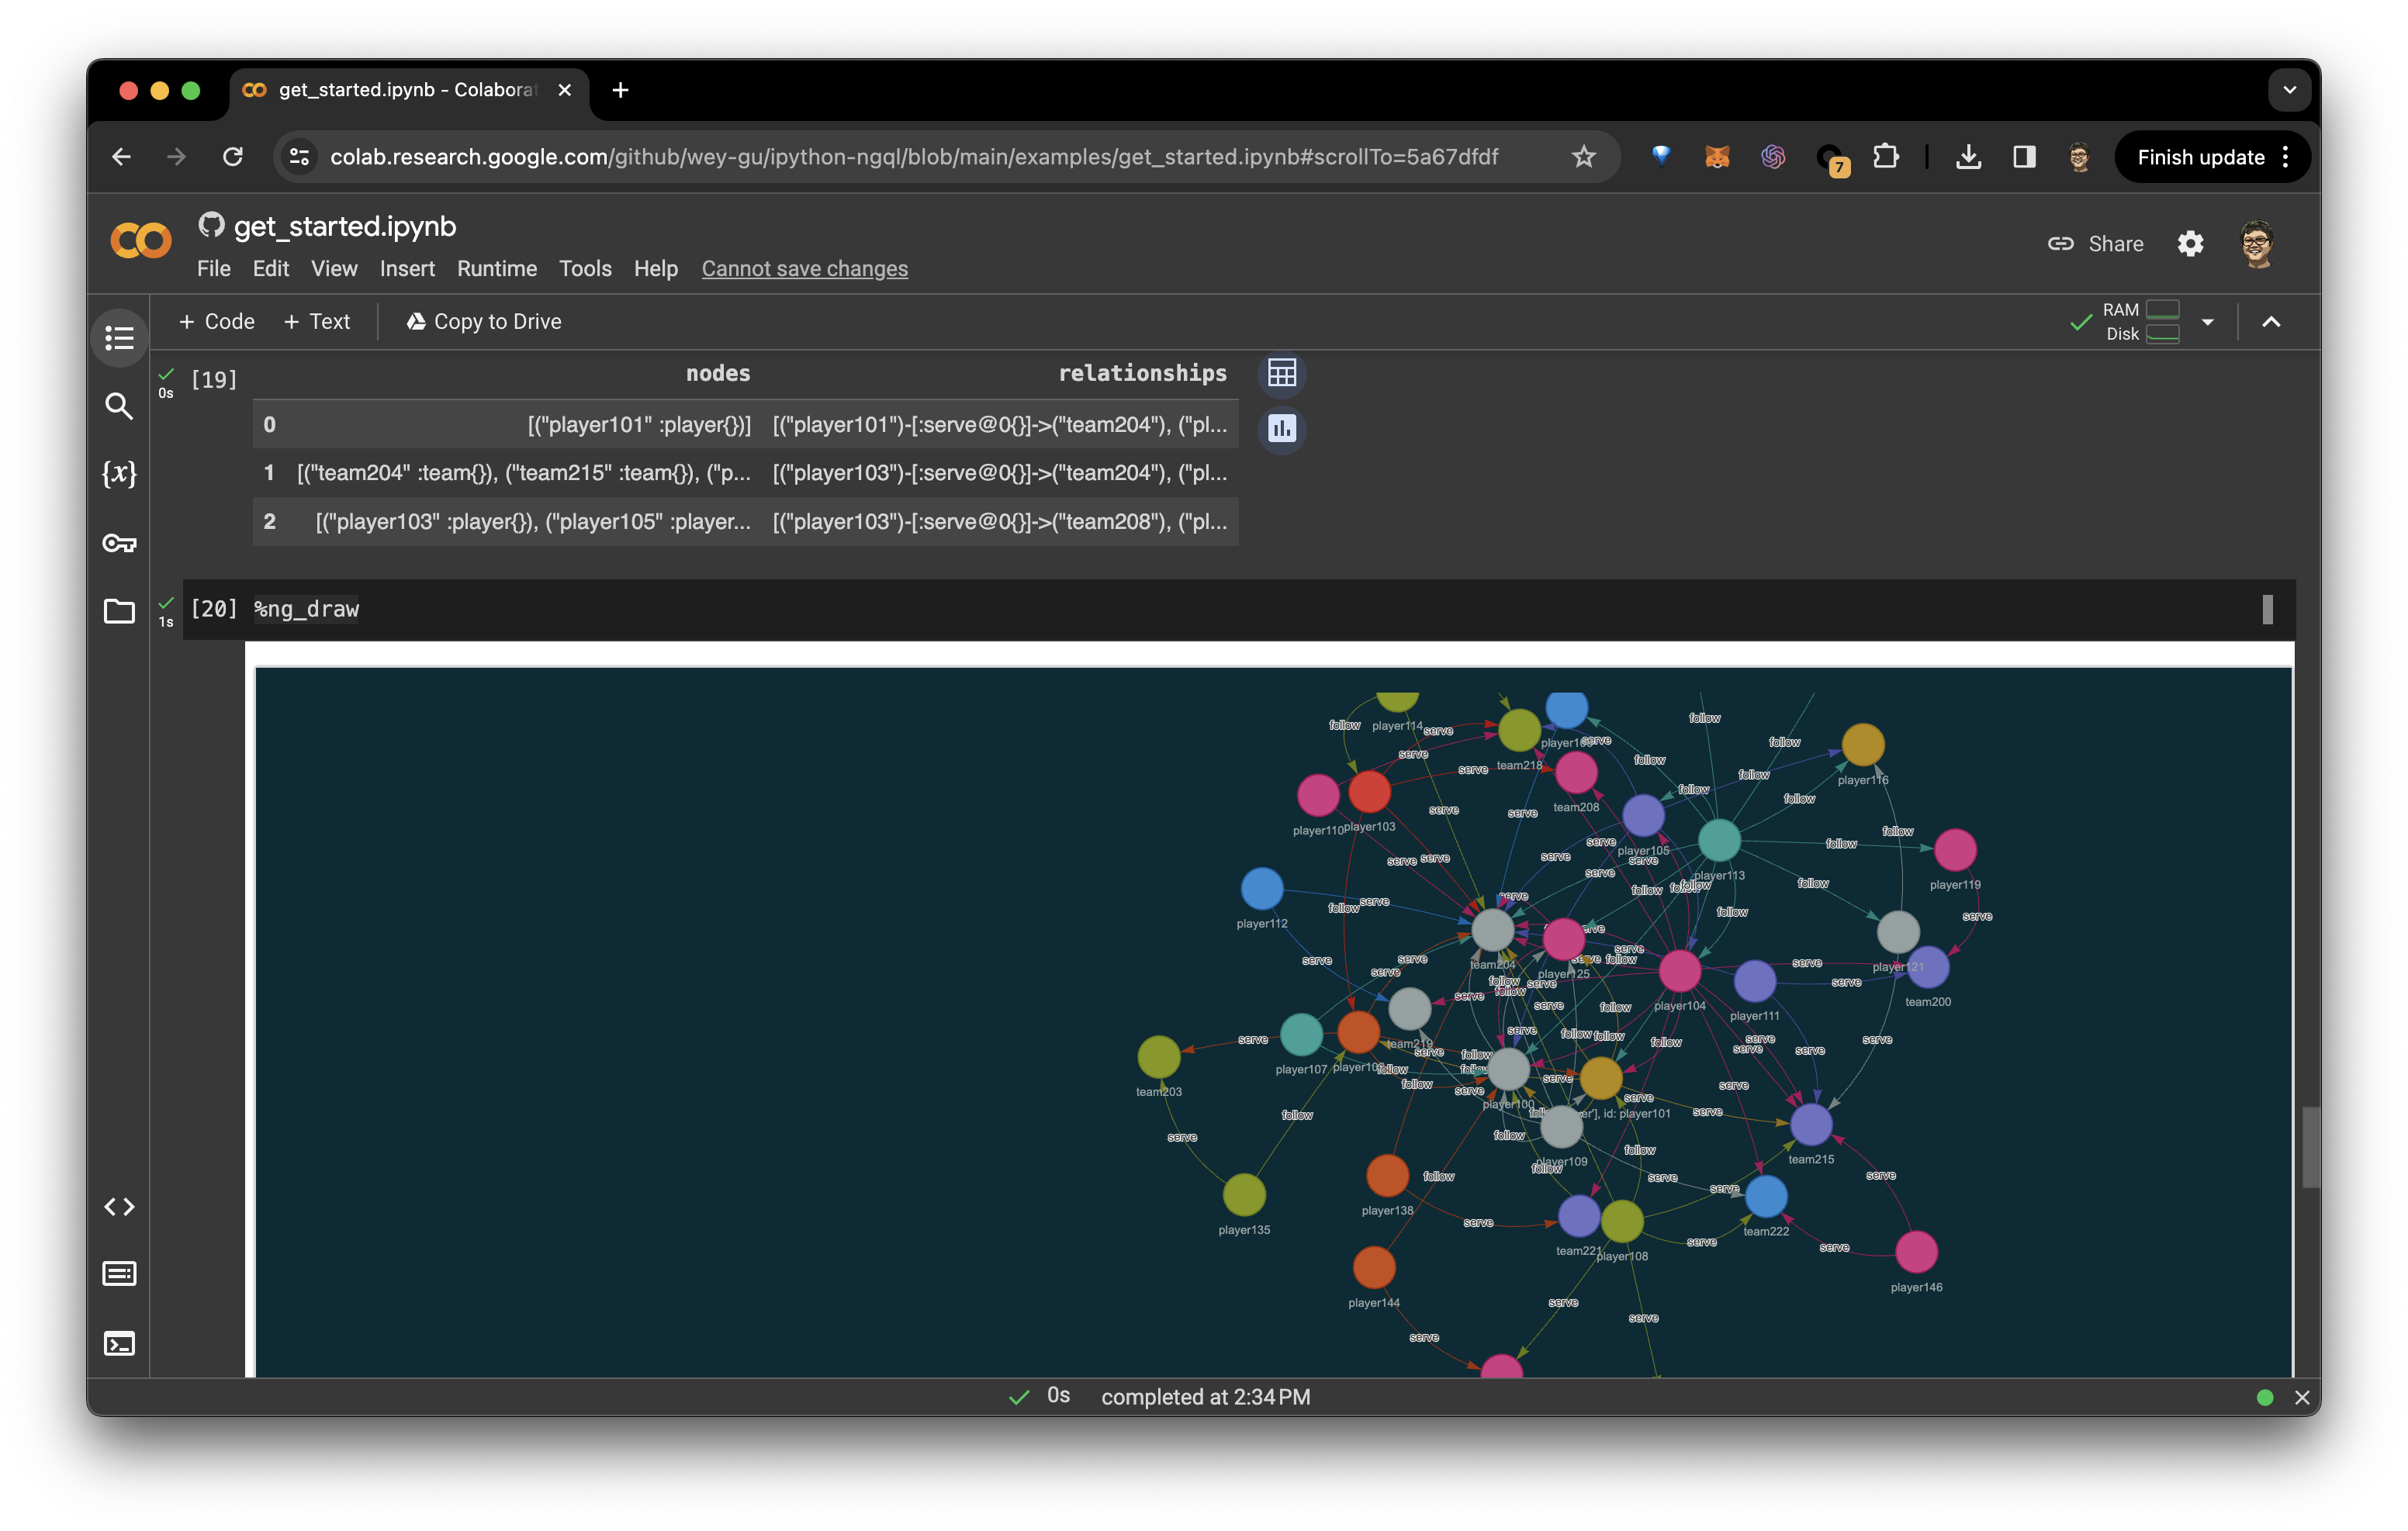
Draw the graph:
%ng_draw
Discover the features of jupyter_nebulagraph by experimenting with it on Google Colab. You can also access a similar Jupyter Notebook in the documentation here.
For a detailed guide, refer to the official documentation.
| Feature | Cheat Sheet | Example | Command Documentation |
|---|---|---|---|
| Connect | %ngql --address 127.0.0.1 --port 9669 --user user --password password |
Connect | %ngql |
| Load Data from CSV | %ng_load --source actor.csv --tag player --vid 0 --props 1:name,2:age --space basketballplayer |
Load Data | %ng_load |
| Query Execution | %ngql MATCH p=(v:player{name:"Tim Duncan"})-->(v2:player) RETURN p; |
Query Execution | %ngql or %%ngql(multi-line) |
| Result Visualization | %ng_draw |
Draw Graph | %ng_draw |
| Draw Schema | %ng_draw_schema |
Draw Schema | %ng_draw_schema |
| Tweak Query Result | df = _ to get last query result as pd.dataframe or ResultSet |
Tweak Result | Configure ngql_result_style |
Click to see more!
Installation
jupyter_nebulagraph could be installed either via pip or from this git repo itself.
Install via pip
pip install jupyter_nebulagraph
Install inside the repo
git clone git@github.com:wey-gu/jupyter_nebulagraph.git
cd jupyter_nebulagraph
python setup.py install
Load it in Jupyter Notebook or iPython
%load_ext ngql
Connect to NebulaGraph
Arguments as below are needed to connect a NebulaGraph DB instance:
| Argument | Description |
|---|---|
--address or -addr |
IP address of the NebulaGraph Instance |
--port or -P |
Port number of the NebulaGraph Instance |
--user or -u |
User name |
--password or -p |
Password |
Below is an exmple on connecting to 127.0.0.1:9669 with username: "user" and password: "password".
%ngql --address 127.0.0.1 --port 9669 --user user --password password
Make Queries
Now two kind of iPtython Magics are supported:
Option 1: The one line stype with %ngql:
%ngql USE basketballplayer;
%ngql MATCH (v:player{name:"Tim Duncan"})-->(v2:player) RETURN v2.player.name AS Name;
Option 2: The multiple lines stype with %%ngql
%%ngql
SHOW TAGS;
SHOW HOSTS;
Query String with Variables
jupyter_nebulagraph supports taking variables from the local namespace, with the help of Jinja2 template framework, it's supported to have queries like the below example.
The actual query string should be GO FROM "Sue" OVER owns_pokemon ..., and "{{ trainer }}" was renderred as "Sue" by consuming the local variable trainer:
In [8]: vid = "player100"

In [9]: %%ngql
   ...: MATCH (v)<-[e:follow]- (v2)-[e2:serve]->(v3)
   ...:   WHERE id(v) == "{{ vid }}"
   ...: RETURN v2.player.name AS FriendOf, v3.team.name AS Team LIMIT 3;
Out[9]:   RETURN v2.player.name AS FriendOf, v3.team.name AS Team LIMIT 3;
FriendOf	Team
0	LaMarcus Aldridge	Trail Blazers
1	LaMarcus Aldridge	Spurs
2	Marco Belinelli	Warriors
Draw query results
Draw Last Query
Just call %ng_draw after queries with graph data.
# one query
%ngql GET SUBGRAPH 2 STEPS FROM "player101" YIELD VERTICES AS nodes, EDGES AS relationships;
%ng_draw

# another query
%ngql match p=(:player)-[]->() return p LIMIT 5
%ng_draw
Draw a Query
Or %ng_draw <one_line_query>, %%ng_draw <multiline_query> instead of drawing the result of the last query.
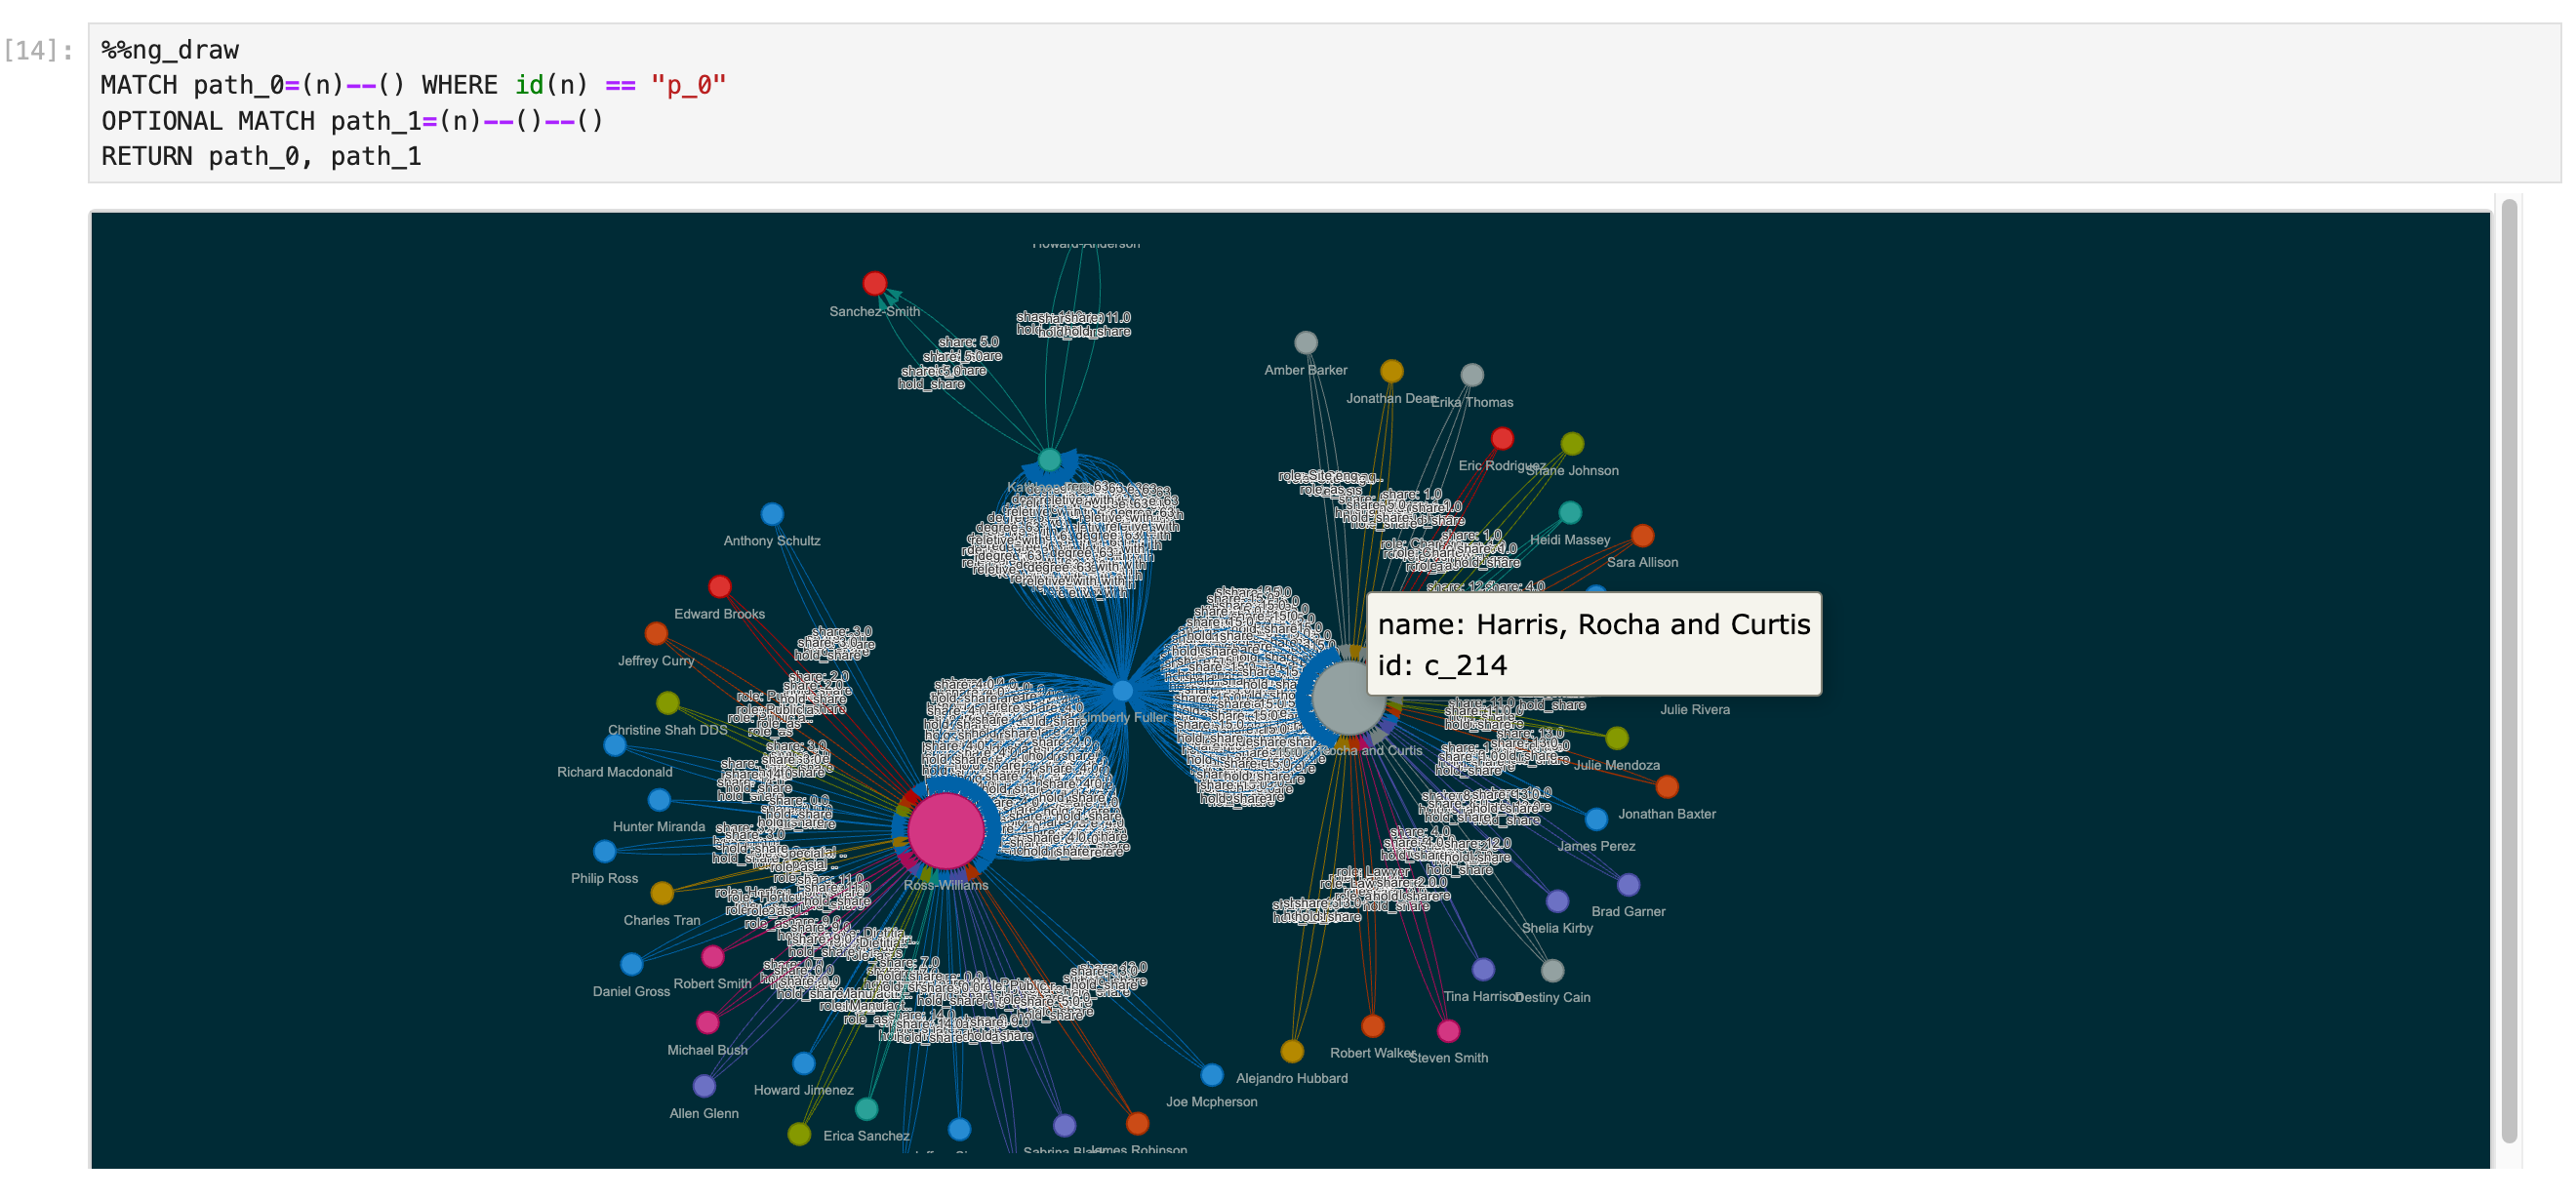
One line query:
%ng_draw GET SUBGRAPH 2 STEPS FROM "player101" YIELD VERTICES AS nodes, EDGES AS relationships;
Multiple lines query:
%%ng_draw
MATCH path_0=(n)--() WHERE id(n) == "p_0"
OPTIONAL MATCH path_1=(n)--()--()
RETURN path_0, path_1
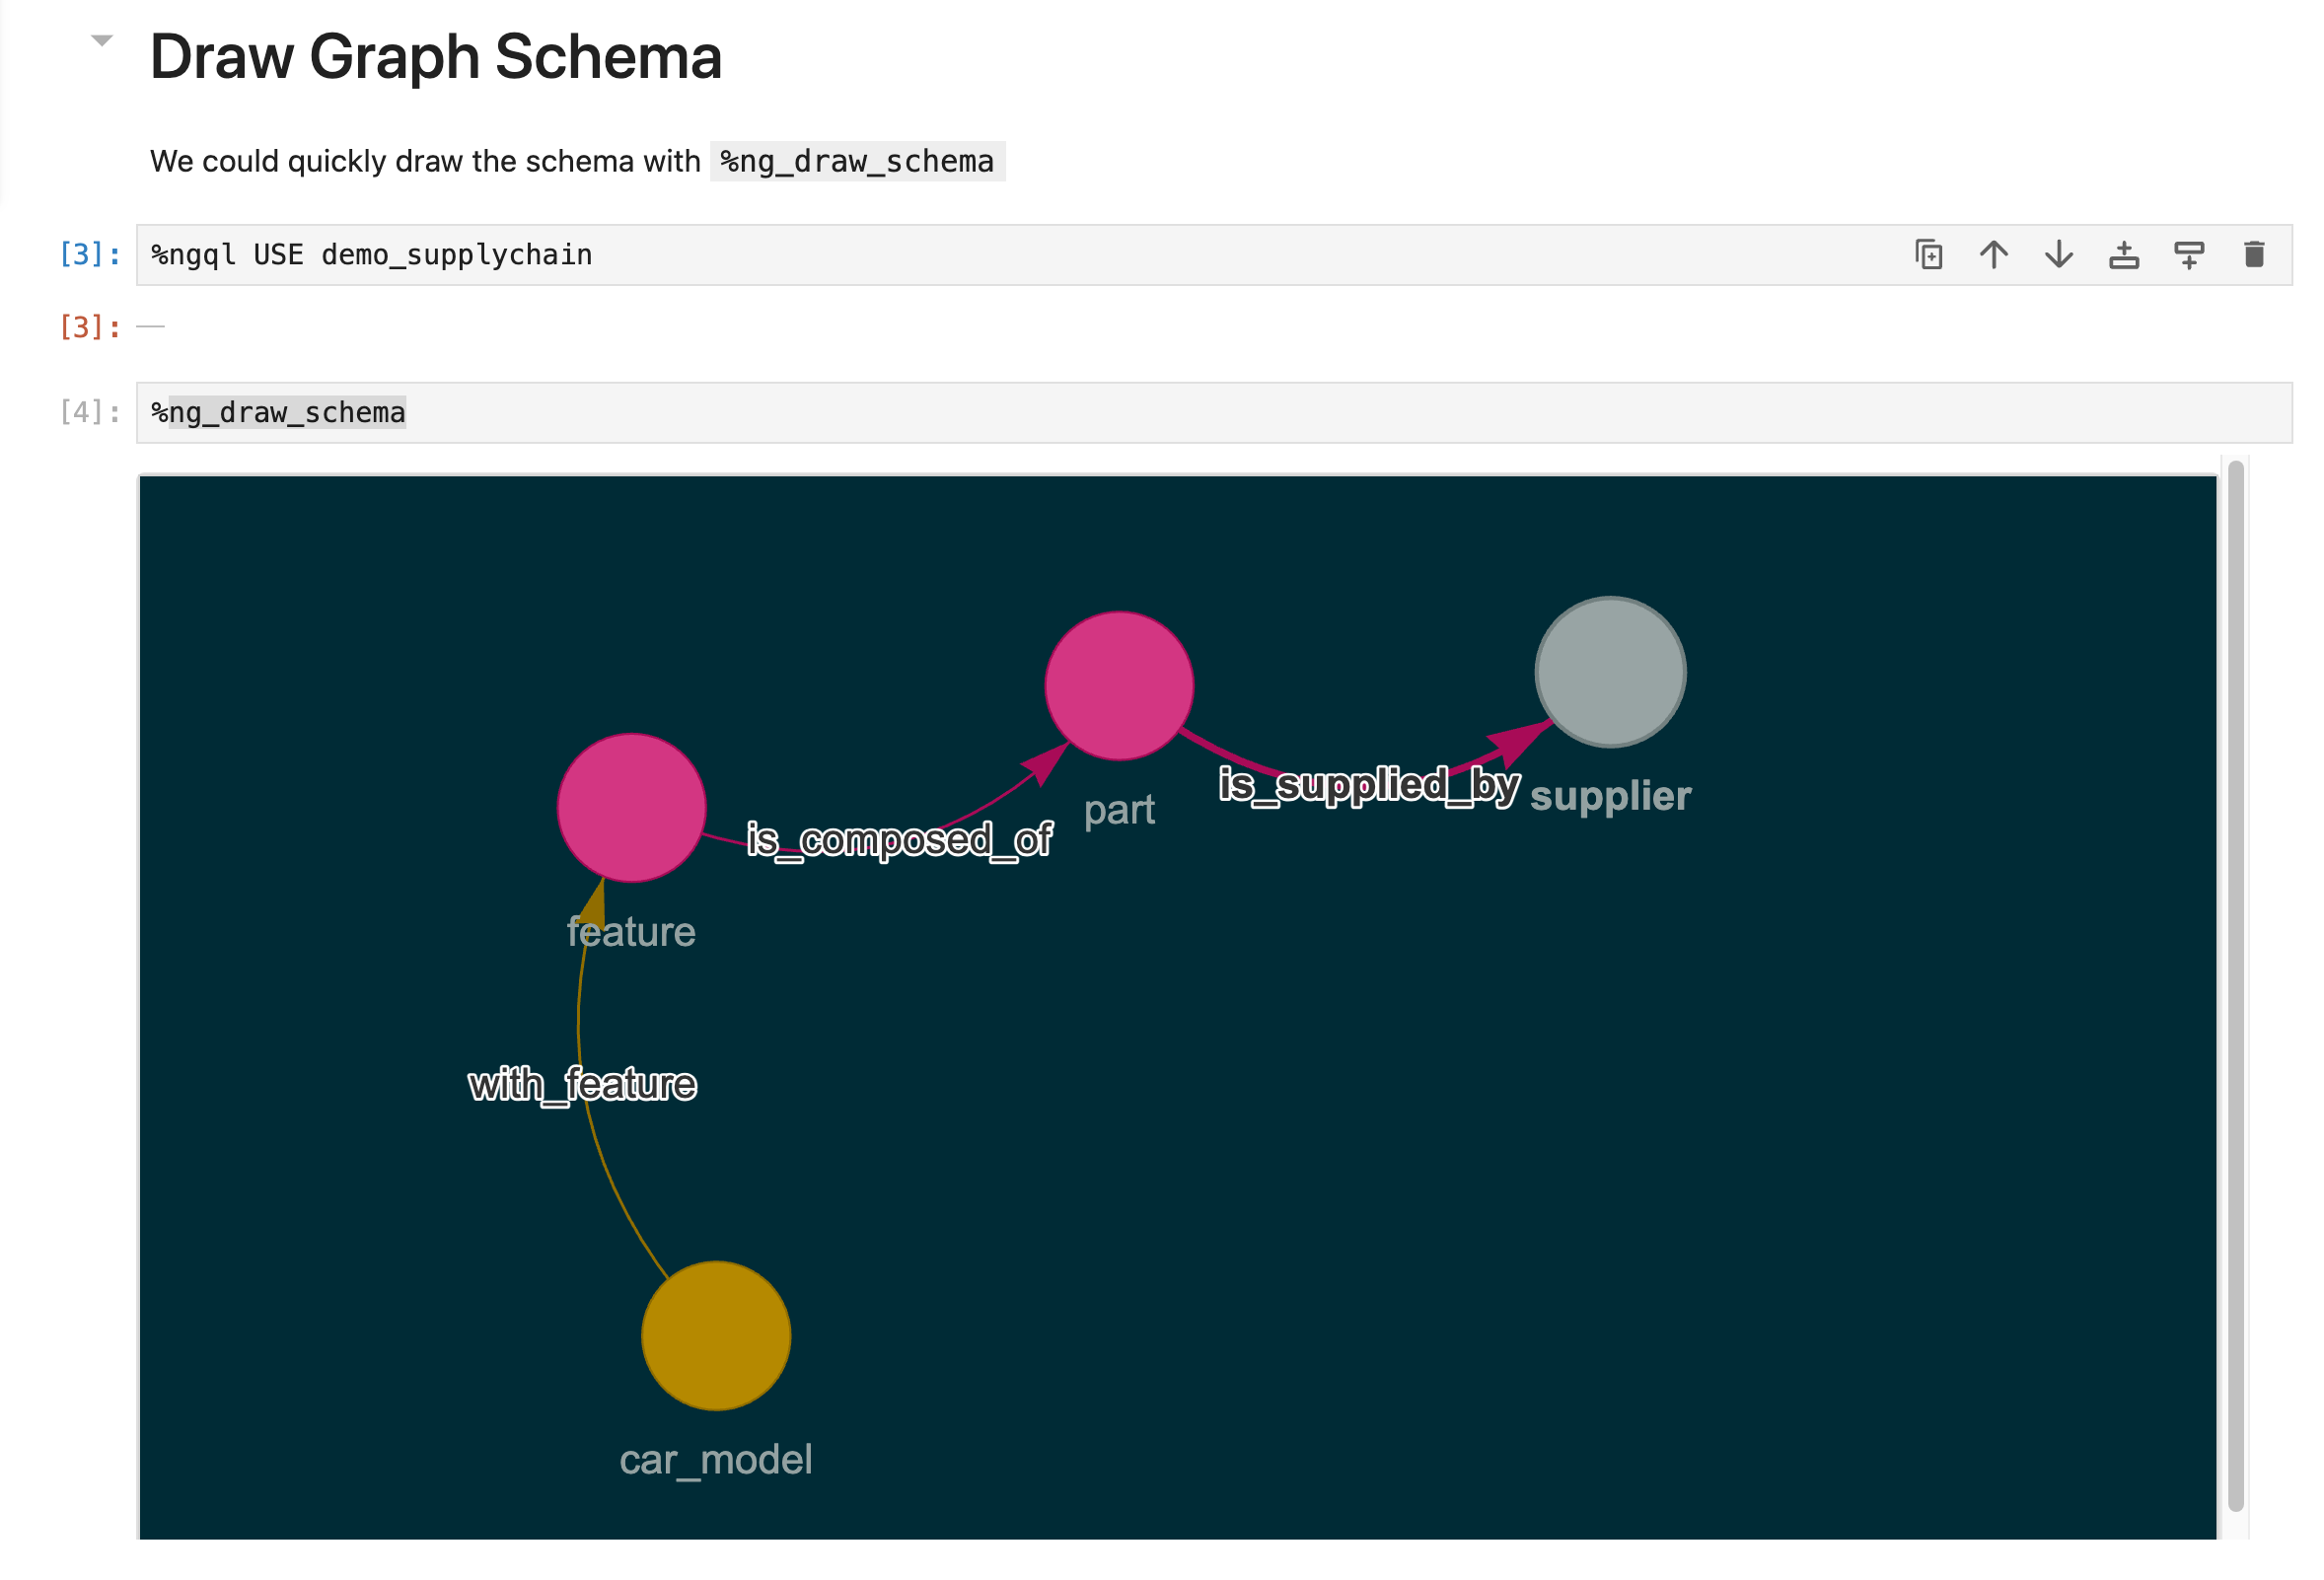
Draw Graph Schema
%ng_draw_schema
Load Data from CSV
It's supported to load data from a CSV file into NebulaGraph with the help of ng_load_csv magic.
For example, to load data from a CSV file actor.csv into a space basketballplayer with tag player and vid in column 0, and props in column 1 and 2:
"player999","Tom Hanks",30
"player1000","Tom Cruise",40
"player1001","Jimmy X",33
Just run the below line:
%ng_load --source actor.csv --tag player --vid 0 --props 1:name,2:age --space basketballplayer
Some other examples:
# load CSV from a URL
%ng_load --source https://github.com/wey-gu/jupyter_nebulagraph/raw/main/examples/actor.csv --tag player --vid 0 --props 1:name,2:age --space demo_basketballplayer
# with rank column
%ng_load --source follow_with_rank.csv --edge follow --src 0 --dst 1 --props 2:degree --rank 3 --space basketballplayer
# without rank column
%ng_load --source follow.csv --edge follow --src 0 --dst 1 --props 2:degree --space basketballplayer
Tweak Query Result
By default, the query result is a Pandas Dataframe, and we could access that by read from variable _.
In [1]: %ngql MATCH (v:player{name:"Tim Duncan"})-->(v2:player) RETURN v2.player.name AS Name;

In [2]: df = _
It's also configurable to have the result in raw ResultSet, to enable handy NebulaGraph Python App Development.
See more via Docs: Result Handling
CheatSheet
If you find yourself forgetting commands or not wanting to rely solely on the cheat sheet, remember this one thing: seek help through the help command!
%ngql help
Acknowledgments ♥️
- Inspiration for this project comes from ipython-sql, courtesy of Catherine Devlin.
- Graph visualization features are enabled by pyvis, a project by WestHealth.
- Generous sponsorship and support provided by Vesoft Inc. and the NebulaGraph community.
2 maintainers


Release files for jupyter-nebulagraph 0.14.3
For a detailed explanation of source distributions (sdists) and built distributions (wheels), please see the package formats documentation.
Source distribution (sdist)
| File | Size | Uploaded | |
|---|---|---|---|
| jupyter_nebulagraph-0.14.3.tar.gz | 18.1 kB | Details |
Built distribution (wheel)
| File | Interpreter | ABI | Platform | Reset |
|---|---|---|---|---|
| jupyter_nebulagraph-0.14.3-py3-none-any.whl | Python 3 | none | any | Details |
Total release size: 37.6 kB
Release files / jupyter_nebulagraph-0.14.3.tar.gz
| Download URL | jupyter_nebulagraph-0.14.3.tar.gz |
|---|---|
| Size | 18.1 kB |
| Tags | Source |
|
SHA-256 checksum How to use checksums |
b3470498d0a6fb9fcbc46cb4c4a8a8e4ecc1de7805465e0c752b6f00a8ab1ab6
|
|
BLAKE2b-256 checksum How to use checksums |
b3071128e2826311254a37279553928594ec790430ecb2dc3ca5f950dad88669
|
| Upload date | |
|
Uploaded using Trusted Publishing? What is trusted publishing? |
No |
| Uploaded via |
twine/5.1.1 CPython/3.9.19
|
Release files / jupyter_nebulagraph-0.14.3-py3-none-any.whl
| Download URL | jupyter_nebulagraph-0.14.3-py3-none-any.whl |
|---|---|
| Size | 19.5 kB |
| Tags | Python 3 |
|
SHA-256 checksum How to use checksums |
48edb1bf3f7afa67e7d5ee6c05edf40ba7d977ab4dbadee9b169b8aa0f0cb60d
|
|
BLAKE2b-256 checksum How to use checksums |
a7bb98964c4e4d0cb1702d41a4ec3d359f08e5f4fdad5d578ff0177ca446e614
|
| Upload date | |
|
Uploaded using Trusted Publishing? What is trusted publishing? |
No |
| Uploaded via |
twine/5.1.1 CPython/3.9.19
|














