Knee-point detection in Python
Verified details
These details have been verified by PyPIProject links
GitHub Statistics
Maintainers

Project description
kneed
Knee-point detection in Python


A Python library for detecting knee (elbow) points in curves using the Kneedle algorithm. Given a set of x and y values, kneed returns the point of maximum curvature.
Features
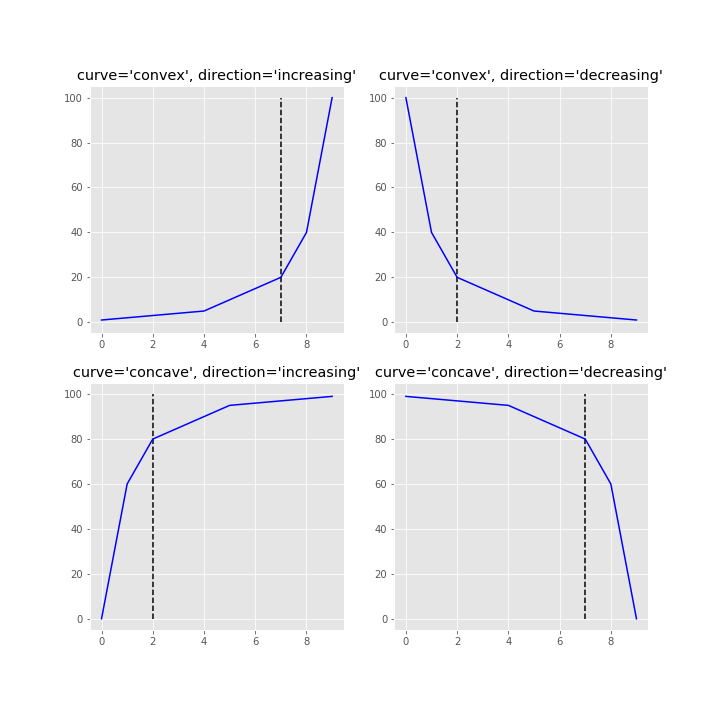
- Detect knee/elbow points in concave or convex curves
- Support for increasing and decreasing functions
- Automatic curve shape detection with
find_shape() - Multiple knee detection via online mode (
all_knees/all_elbows) - Tunable sensitivity parameter (
S) - Multiple interpolation methods (
interp1d,polynomial) - Built-in plotting for quick visualizations
Installation
kneed has been tested with Python 3.8, 3.9, 3.10, 3.11, and 3.12.
anaconda
conda install -c conda-forge kneed
pip
pip install kneed              # knee-detection only
pip install kneed[plot]        # also install matplotlib for visualizations
Clone from GitHub
git clone https://github.com/arvkevi/kneed.git && cd kneed
pip install -e .
Quick Start
from kneed import KneeLocator, DataGenerator

# Generate sample data
x, y = DataGenerator.figure2()

# Find the knee point
kl = KneeLocator(x, y, curve="concave", direction="increasing")
print(kl.knee)       # 0.222
print(kl.knee_y)     # 1.897
If you're unsure about the curve type and direction, use find_shape() to auto-detect:
from kneed import find_shape

direction, curve = find_shape(x, y)
kl = KneeLocator(x, y, curve=curve, direction=direction)
Usage
These steps reproduce Figure 2 from the original Kneedle manuscript.
Input Data
The DataGenerator class is a utility to generate sample datasets.
Note:
xandymust be equal length arrays.
from kneed import DataGenerator, KneeLocator

x, y = DataGenerator.figure2()

print([round(i, 3) for i in x])
print([round(i, 3) for i in y])

[0.0, 0.111, 0.222, 0.333, 0.444, 0.556, 0.667, 0.778, 0.889, 1.0]
[-5.0, 0.263, 1.897, 2.692, 3.163, 3.475, 3.696, 3.861, 3.989, 4.091]
Find Knee
The knee (or elbow) point is calculated by instantiating the KneeLocator class with x, y and the appropriate curve and direction.
Here, kneedle.knee and kneedle.elbow store the point of maximum curvature.
kneedle = KneeLocator(x, y, S=1.0, curve="concave", direction="increasing")

print(round(kneedle.knee, 3))
0.222

print(round(kneedle.elbow, 3))
0.222
The knee point returned is a value along the x axis. The y value at the knee can be identified:
print(round(kneedle.knee_y, 3))
1.897
Visualize
The KneeLocator class has two plotting functions for quick visualizations.
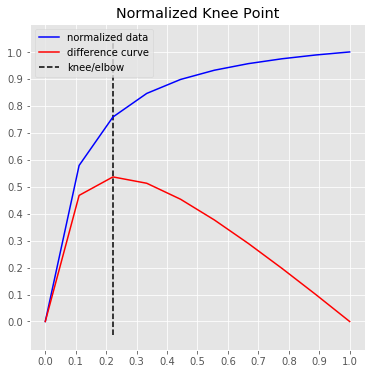
Note that all (x, y) are transformed for the normalized plots
# Normalized data, normalized knee, and normalized distance curve.
kneedle.plot_knee_normalized()
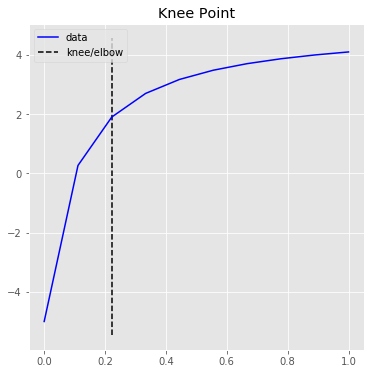
# Raw data and knee.
kneedle.plot_knee()
Documentation
Full documentation including parameter tuning guides, real-world examples, and API reference is available at kneed.readthedocs.io.
Interactive
An interactive Streamlit app is available to explore the effect of tuning parameters:
share.streamlit.io/arvkevi/ikneed
You can also run your own version — head over to the source code for ikneed.

Contributing
Contributions are welcome, please refer to CONTRIBUTING to learn more about how to contribute.
Citation
If you use kneed in your research, please cite:
Satopa, V., Albrecht, J., Irwin, D., and Raghavan, B. (2011). "Finding a 'Kneedle' in a Haystack: Detecting Knee Points in System Behavior." 31st International Conference on Distributed Computing Systems Workshops, pp. 166-171.
@inproceedings{satopa2011kneedle,
  title={Finding a "Kneedle" in a Haystack: Detecting Knee Points in System Behavior},
  author={Satopa, Ville and Albrecht, Jeannie and Irwin, David and Raghavan, Barath},
  booktitle={31st International Conference on Distributed Computing Systems Workshops},
  pages={166--171},
  year={2011},
}
Project details
Verified details
These details have been verified by PyPIProject links
GitHub Statistics
Maintainers
Release history Release notifications | RSS feed


Download files
Download the file for your platform. If you're not sure which to choose, learn more about installing packages.
Source Distribution
Built Distribution
Filter files by name, interpreter, ABI, and platform.
If you're not sure about the file name format, learn more about wheel file names.
Copy a direct link to the current filters
File details
Details for the file kneed-0.8.6.tar.gz.
File metadata
- Download URL: kneed-0.8.6.tar.gz
- Upload date:
- Size: 13.2 kB
- Tags: Source
- Uploaded using Trusted Publishing? Yes
- Uploaded via: twine/6.1.0 CPython/3.13.7
File hashes
| Algorithm | Hash digest | |
|---|---|---|
| SHA256 |
65b22727c623661701f15edf057f2e6c73e2b1ad4e68cd9ca4291675c318b5ef
|
|
| MD5 |
9d64816218027557d24a855ed4354df1
|
|
| BLAKE2b-256 |
72644bb8f8a7a4627b585a66d5bec0c9b30ae5b39a4caea1775c8bfb3fb3f4cf
|
Provenance
The following attestation bundles were made for kneed-0.8.6.tar.gz:
Publisher:
pythonpublish.yml on arvkevi/kneed
-
Statement:
-
Statement type:
https://in-toto.io/Statement/v1 -
Predicate type:
https://docs.pypi.org/attestations/publish/v1 -
Subject name:
kneed-0.8.6.tar.gz -
Subject digest:
65b22727c623661701f15edf057f2e6c73e2b1ad4e68cd9ca4291675c318b5ef - Sigstore transparency entry: 1150652005
- Sigstore integration time:
-
Permalink:
arvkevi/kneed@ad1449ffa0fdb7f8ac7d74c75d77159562d92fdf -
Branch / Tag:
refs/tags/v0.8.6 - Owner: https://github.com/arvkevi
-
Access:
public
-
Token Issuer:
https://token.actions.githubusercontent.com -
Runner Environment:
github-hosted -
Publication workflow:
pythonpublish.yml@ad1449ffa0fdb7f8ac7d74c75d77159562d92fdf -
Trigger Event:
release
-
Statement type:
File details
Details for the file kneed-0.8.6-py3-none-any.whl.
File metadata
- Download URL: kneed-0.8.6-py3-none-any.whl
- Upload date:
- Size: 10.8 kB
- Tags: Python 3
- Uploaded using Trusted Publishing? Yes
- Uploaded via: twine/6.1.0 CPython/3.13.7
File hashes
| Algorithm | Hash digest | |
|---|---|---|
| SHA256 |
3412e7b70bce07717386d24fab37f0f985968d1b85ea0c749a6b98caccaf65ec
|
|
| MD5 |
5644aa67a613f431cae78d6da4e763c9
|
|
| BLAKE2b-256 |
4acd23c89d53c36028bccb39f55aa5dd24c4bdaab76c4d556ad43dc8cf026918
|
Provenance
The following attestation bundles were made for kneed-0.8.6-py3-none-any.whl:
Publisher:
pythonpublish.yml on arvkevi/kneed
-
Statement:
-
Statement type:
https://in-toto.io/Statement/v1 -
Predicate type:
https://docs.pypi.org/attestations/publish/v1 -
Subject name:
kneed-0.8.6-py3-none-any.whl -
Subject digest:
3412e7b70bce07717386d24fab37f0f985968d1b85ea0c749a6b98caccaf65ec - Sigstore transparency entry: 1150652048
- Sigstore integration time:
-
Permalink:
arvkevi/kneed@ad1449ffa0fdb7f8ac7d74c75d77159562d92fdf -
Branch / Tag:
refs/tags/v0.8.6 - Owner: https://github.com/arvkevi
-
Access:
public
-
Token Issuer:
https://token.actions.githubusercontent.com -
Runner Environment:
github-hosted -
Publication workflow:
pythonpublish.yml@ad1449ffa0fdb7f8ac7d74c75d77159562d92fdf -
Trigger Event:
release
-
Statement type:


