Decline in transcriptional homeostasis defines aging

Project description
HDS Package
Age-dependent dysregulation of transcription regulatory machinery triggers modulations in the gene expression levels leading to the decline in cellular fitness. Tracking of these transcripts along the temporal axis in multiple species revealed a spectrum of evolutionarily conserved pathways, such as electron transport chain, translation regulation, DNA repair, etc. Recent shreds of evidence suggest that aging deteriorates the transcription machinery itself, indicating the hidden complexity of the aging transcriptomes. This reinforces the need for devising novel computational methods to view aging through the lens of transcriptomics. Here, we present Homeostatic Divergence Score (HDS) to quantify the extent of messenger RNA (mRNA) homeostasis by assessing the balance between spliced and unspliced mRNA repertoire in single cells. By tracking HDS across single-cell expression profiles of human pancreas we identified a core set of 171 transcripts undergoing an age-dependent homeostatic breakdown. Notably, many of these transcripts are well-studied in the context of organismal aging. Our preliminary analyses in this direction suggest that mRNA processing level information offered by single-cell RNA sequencing (scRNA-seq) data is a superior determinant of chronological age as compared to transcriptional noise.
Instructions
How to install?
-
These are are required packages:
scipy, numpy, pandas, velocyto, scanpy, anndata, matplotlib, seaborn, matplotlib_venn, leidenalg and scikit-learn
-
To install these packages use below command
!pip install scipy numpy pandas velocyto scanpy anndata matplotlib seaborn matplotlib_venn leidenalg scikit-learn
-
Get latest version of HDS from the link given below:
-
Install it using below command.
pip install krishang_HDS
How to make loom files from fastq files?
-
Download fastq files from the link given below (or any other link):
https://www.ebi.ac.uk/arrayexpress/experiments/E-MTAB-6687/samples/
-
For 10x fastq files, use the 'cellranger count' command to generate bam files.
For example:
cellranger count --id=$sample --transcriptome=$transcriptome --fastqs=/sample.fastqs --sample=$sample --expect-cells=8000 --localcores=12
FYI: Download transcriptome from the link given below:
https://support.10xgenomics.com/single-cell-gene-expression/software/downloads/latest
-
'STAR' tool can also be used for alignment to reference genome and generate bam file.
For example:
STAR --runThreadN 12 --genomeDir /star_mouse/index --sjdbGTFfile /gencode.vM25.primary_assembly.annotation.gtf --readFilesIn $line1.fastq.gz $line2.fastq.gz --outFileNamePrefix $line.bam --readFilesCommand zcat --outSAMtype BAM SortedByCoordinate
- Create star index using standard parameters
- Download gtf file from the link given below:
-
Generate the loom file using velocyto command.
For example:
For 10x data, use the command written below:
velocyto run10x -m hg19_rmsk.gtf sample_folder/01 refdata-gex-GRCh38-2020-A/genes/genes.gtf
- Download gtf file from the link given below:
https://www.gencodegenes.org/human/
- Download mask file from the link given below:
- For STAR generated bam files, use the command written below:
velocyto run -b filtered_barcodes.tsv -o output_path -m repeat_msk_srt.gtf possorted_genome_bam.bam mm10_annotation.gtf
How to use?
-
from krishang_HDS import HDS
HDS("path of loom file")
For example:
HDS("/home/krishan/loom/abc.loom")
-
Use 'clusters' parameter to pass cluster identity of cells if you have. Otherwise, HDS by default uses 'leiden' method with resolution = 1, inbuilt in scanpy package. Note: clusters labels should be in the same order as barcode in the loom file.
For example:
HDS(path1="path of loom file", clusters=[1,2,1,2,3,4,5])
-
Use 'per' parameter to specify the X percentile genes with top HDS score. This could be important since HDS can return large negative valuesthereby distorting the overall distribution plots involving HDS scores.
-
Use 'genes' parameter to pass speific genes for which you want to generate the phase portraits.
For example:
HDS(path1="path of loom file", genes=['GENE1','GENE2'])
-
Notably default scanpy parameters are (you can change it):
min_genes=200, min_cells=3, n_genes_by_counts=2500, pct_counts_mt=5
To understand the relevance of these parameters check out:
-
We have created a Google colab notebook with the code and loom file. Link is given below:
https://drive.google.com/drive/folders/1Pq9IsjnCYaJngU8WQ0E1RjIqA9f-j3lY?usp=sharing
Output?
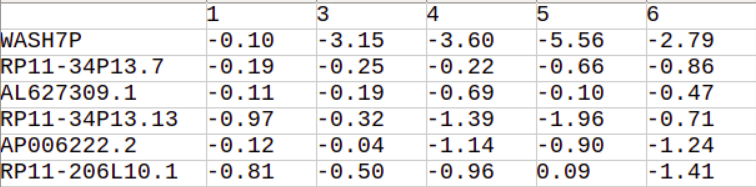
HDS function will return a pandas data frame cantaining HDS scores of genes across all clusters.
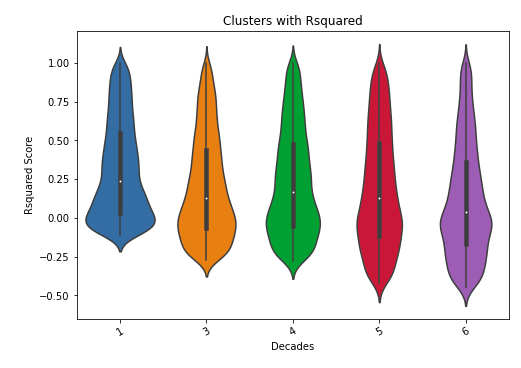
HDS score distribution for each supplied cluster
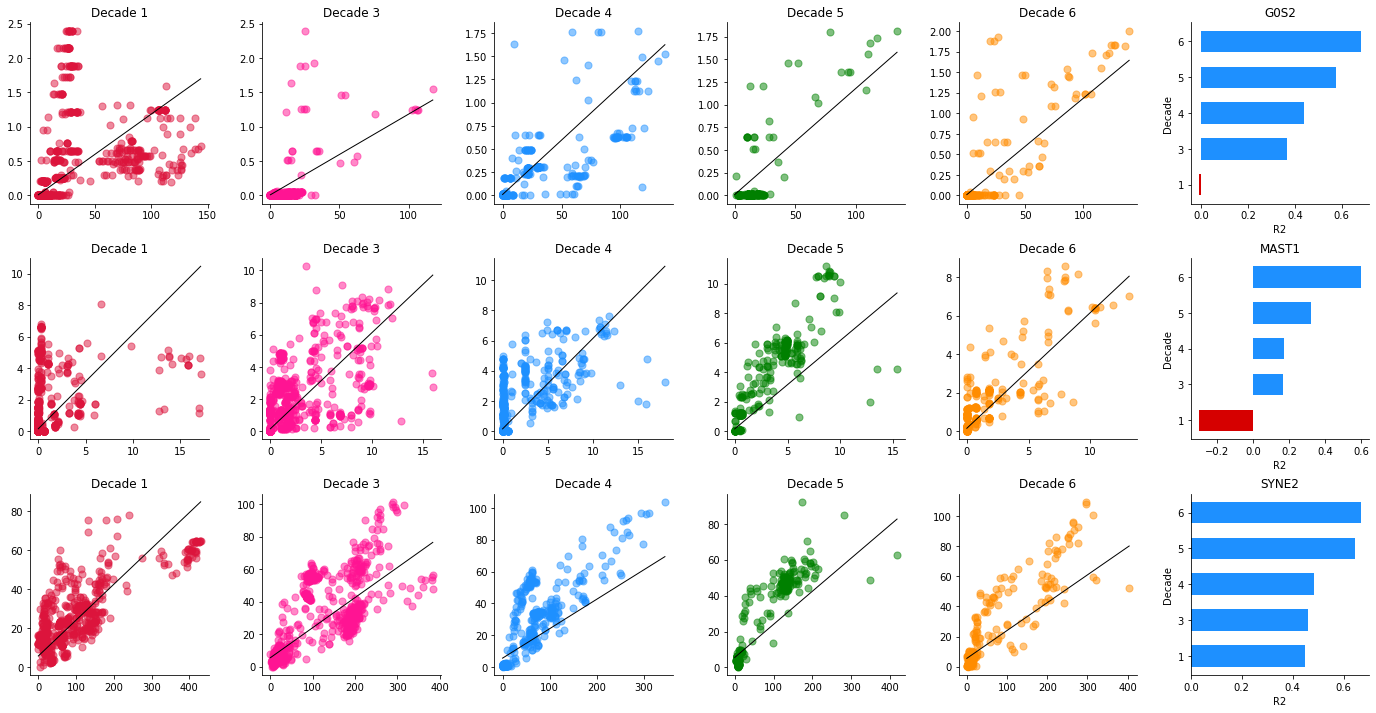
Example phase portraits of genes under homeostasis breakdown
Release history Release notifications | RSS feed


Download files
Download the file for your platform. If you're not sure which to choose, learn more about installing packages.
Source Distribution
Built Distribution
Filter files by name, interpreter, ABI, and platform.
If you're not sure about the file name format, learn more about wheel file names.
Copy a direct link to the current filters
File details
Details for the file krishang_HDS-0.0.2.tar.gz.
File metadata
- Download URL: krishang_HDS-0.0.2.tar.gz
- Upload date:
- Size: 9.6 kB
- Tags: Source
- Uploaded using Trusted Publishing? No
- Uploaded via: twine/3.1.1 pkginfo/1.4.2 requests/2.22.0 setuptools/45.2.0 requests-toolbelt/0.8.0 tqdm/4.30.0 CPython/3.8.5
File hashes
| Algorithm | Hash digest | |
|---|---|---|
| SHA256 |
832b24c801eee1297cb309052741f5d358dc4ecf6b65182dd679b0a96ac0f460
|
|
| MD5 |
88e559a9af79524e9ab9b8c8ec62b455
|
|
| BLAKE2b-256 |
233e478833d4aba38a8f1f5f2babc247be3c380de59db17a0190263ed96f6af5
|
File details
Details for the file krishang_HDS-0.0.2-py3-none-any.whl.
File metadata
- Download URL: krishang_HDS-0.0.2-py3-none-any.whl
- Upload date:
- Size: 8.9 kB
- Tags: Python 3
- Uploaded using Trusted Publishing? No
- Uploaded via: twine/3.1.1 pkginfo/1.4.2 requests/2.22.0 setuptools/45.2.0 requests-toolbelt/0.8.0 tqdm/4.30.0 CPython/3.8.5
File hashes
| Algorithm | Hash digest | |
|---|---|---|
| SHA256 |
c479eca34b2d58787bdf05441652a1f7408f56a4afce2e7d97de726c4f031c60
|
|
| MD5 |
c31cc2e10de382973197e7cd6d434cfe
|
|
| BLAKE2b-256 |
16c2db442e1d0a283482188d46d870ce7d8358964f26f47bdff92662a7441f6a
|


