Terrain and hydrological analysis based on LiDAR-derived digital elevation models (DEM)

Project description
lidar


Author: Qiusheng Wu (https://wetlands.io | wqs@binghamton.edu)
lidar is a toolset for terrain and hydrological analysis using digital elevation models (DEMs). It is particularly useful for analyzing high-resolution topographic data, such as DEMs derived from Light Detection and Ranging (LiDAR) data.
GitHub repo: https://github.com/giswqs/lidar
Documentation: https://lidar.readthedocs.io.
Free software: MIT license
Features
Smoothing DEMs using mean, median, and Gaussian filters (see filtering.py)
Extracting depressions from DEMs (see filling.py).
Filtering out small artifact depressions based on user-specified minimum depression size (see filling.py).
Generating refined DEMs with small depressions filled but larger depressions kept intact (see filling.py).
Delineating depression nested hierarchy using the level-set method (see slicing.py).
Delineating mount nested hierarchy using the level-set method (see mounts.py).
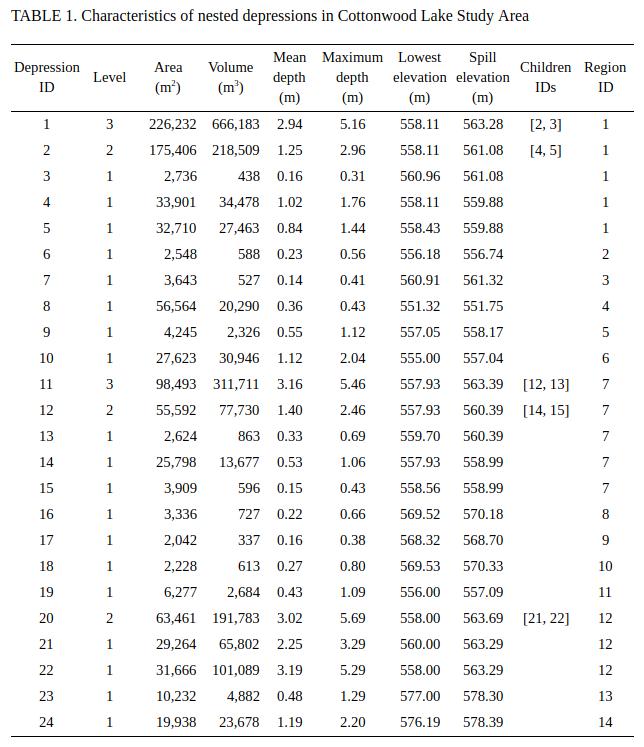
Computing topological and geometric properties of depressions, including size, volume, mean depth, maximum depth, lowest elevation, spill elevation, perimeter, major axis length, minor axis length, elongatedness, eccentricity, orientation, and area-bbox-ratio (see slicing.py).
Exporting depression properties as a csv file (see slicing.py).
Using It
Install the Python package using the following command:
pip install lidarAnd use:
import os
import pkg_resources
import lidar

# identify the sample data directory of the package
package_name = 'lidar'
data_dir = pkg_resources.resource_filename(package_name, 'data/')

# use the sample dem. Change it to your own dem if needed
in_dem = os.path.join(data_dir, 'dem.tif')
# set output directory. By default, use the temp directory under user's home directory
out_dir = os.path.join(os.path.expanduser("~"), "temp")

# parameters for identifying sinks and delineating nested depressions
min_size = 1000      # minimum number of pixels as a depression
min_depth = 0.5      # minimum depth as a depression
interval = 0.3       # slicing interval for the level-set method
bool_shp = False     # output shapefiles for each individual level

# extracting sinks based on user-defined minimum depression size
out_dem = os.path.join(out_dir, "median.tif")
in_dem = MedianFilter(in_dem, kernel_size=3, out_file=out_dem)
sink_path = ExtractSinks(in_dem, min_size, out_dir)
dep_id_path, dep_level_path = DelineateDepressions(sink_path, min_size, min_depth, interval, out_dir, bool_shp)
Check the example.py for more details.
Dependencies
lidar’s Python dependencies are listed in its requirements.txt file. In addition, lidar has a C library dependency: GDAL >=1.11.2. How to install GDAL in different operating systems will be explained below. More informaton about GDAL can be found here.
Linux
The following commands can be used to install GDAL for Linux distributions.
sudo add-apt-repository ppa:ubuntugis/ppa
sudo apt-get update
sudo apt-get install gdal-bin libgdal-dev
After installing GDAL, the following commands are recommended before installing PyGDAL to avoid potential compiling errors.
sudo apt-get install --reinstall build-essential
sudo apt-get install python3-dev
pip install wheel
MacOS X
For a Homebrew based Python environment, do the following.
brew update
brew install gdal
Alternatively, you can install GDAL binaries from kyngchaos. You will then need to add the installed location /Library/Frameworks/GDAL.framework/Programs to your system path.
Windows
I would recommend installing GDAL using OSGeo4W. After installation, The GDAL dll and gdal-data directory need to be added to your Windows PATH. Check this instruction on how to add GDAL to system PATH.
Examples
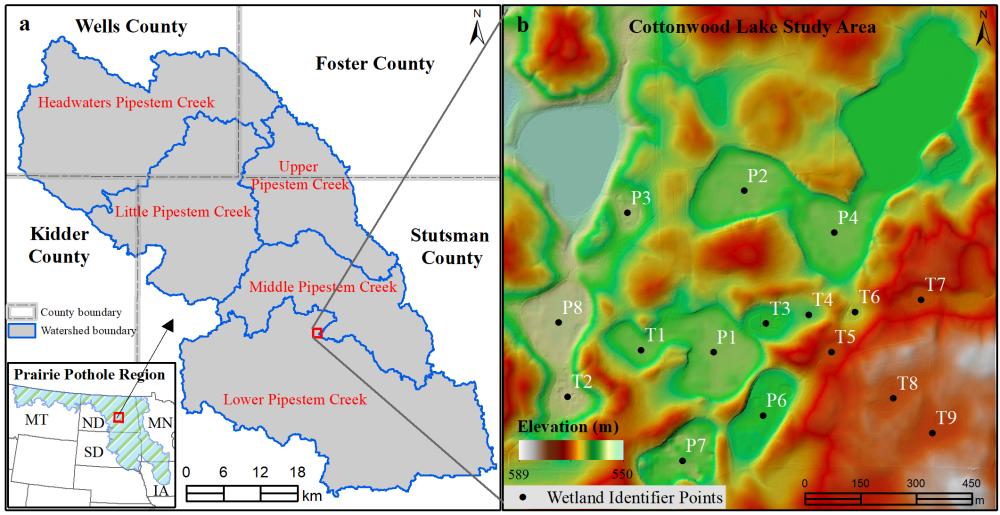
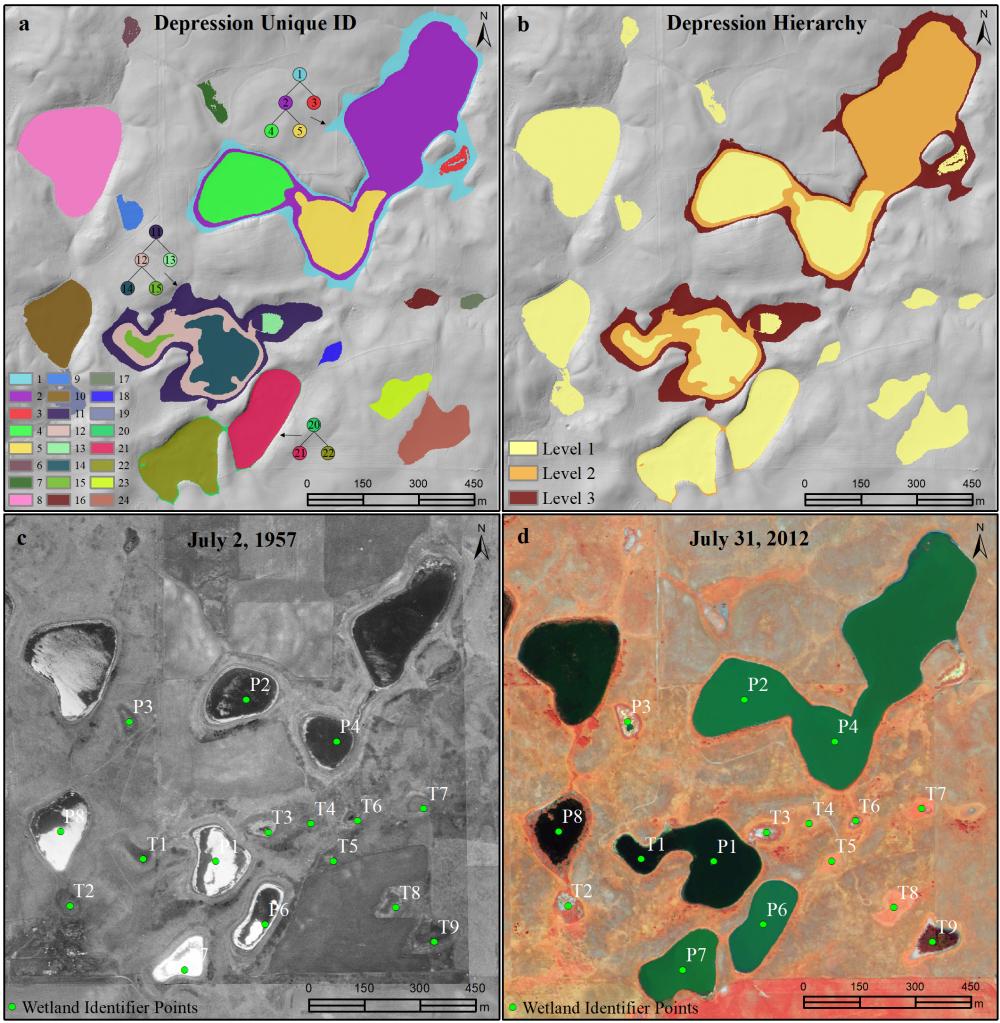
The images below show working examples of the level set method for delineating nested depressions in the Cottonwood Lake Study Area (CLSA), North Dakota. More test datasets (e.g., the Pipestem watershed in the Prairie Pothole Region of North Dakota) can be downloaded from http://gishub.org/2018-JAWRA-Data
The following example was conducted on a 64-bit Linux machine with a quad-core Intel i7-7700 CPU and 16 GB RAM. The average running time of the algorithm for this DEM was 0.75 seconds.
Publications
The level-set algorithm in the lidar package has been published in the following article:
Wu, Q., Lane, C.R., Wang, L., Vanderhoof, M.K., Christensen, J.R., & Liu, H. (2018). Efficient Delineation of Nested Depression Hierarchy in Digital Elevation Models for Hydrological Analysis Using Level-Set Method. Journal of the American Water Resources Association. (in press) preprint
Applications of the level-set and contour-tree methods for feature extraction from LiDAR data:
Wu, Q., & Lane, C.R. (2017). Delineating wetland catchments and modeling hydrologic connectivity using LiDAR data and aerial imagery. Hydrology and Earth System Sciences. 21: 3579-3595. DOI: 10.5194/hess-21-3579-2017
Wu, Q., Deng, C., & Chen, Z. (2016). Automated delineation of karst sinkholes from LiDAR-derived digital elevation models. Geomorphology. 266: 1-10. DOI: 10.1016/j.geomorph.2016.05.006
Wu, Q., Su, H., Sherman, D.J., Liu, H., Wozencraft, J.M., Yu, B., & Chen, Z. (2016). A graph-based approach for assessing storm-induced coastal changes. International Journal of Remote Sensing. 37:4854-4873. DOI: 10.1080/01431161.2016.1225180
Wu, Q., & Lane, C.R. (2016). Delineation and quantification of wetland depressions in the Prairie Pothole Region of North Dakota. Wetlands. 36(2):215–227. DOI: 10.1007/s13157-015-0731-6
Wu, Q., Liu, H., Wang, S., Yu, B., Beck, R., & Hinkel, K. (2015). A localized contour tree method for deriving geometric and topological properties of complex surface depressions based on high-resolution topographic data. International Journal of Geographical Information Science. 29(12): 2041-2060. DOI: 10.1080/13658816.2015.1038719
Wu, Q., Lane, C.R., & Liu, H. (2014). An effective method for detecting potential woodland vernal pools using high-resolution LiDAR data and aerial imagery. Remote Sensing. 6(11):11444-11467. DOI: 10.3390/rs61111444
Credits
The algorithms are built on richdem, numpy, scipy, scikit-image, and pygdal.
This package was created with Cookiecutter and the audreyr/cookiecutter-pypackage project template.
History
0.1.6 (2018-05-21)
0.1.5 (2018-05-16)
0.1.3 (2018-05-15)
0.1.0 (2018-05-14)
First release on PyPI.
Release history Release notifications | RSS feed


Download files
Download the file for your platform. If you're not sure which to choose, learn more about installing packages.
Source Distribution
File details
Details for the file lidar-0.1.10.tar.gz.
File metadata
- Download URL: lidar-0.1.10.tar.gz
- Upload date:
- Size: 1.1 MB
- Tags: Source
- Uploaded using Trusted Publishing? No
- Uploaded via: twine/1.10.0 pkginfo/1.4.2 requests/2.19.1 setuptools/39.1.0 requests-toolbelt/0.8.0 tqdm/4.25.0 CPython/3.6.6
File hashes
| Algorithm | Hash digest | |
|---|---|---|
| SHA256 |
60d91746a24138d9c3cfddbb2e5c59ad5debd4134bef0c48f627e1eb3093003b
|
|
| MD5 |
9fecc98bba06bc9329a86834c336d314
|
|
| BLAKE2b-256 |
0595214f42c5a514c7bba28365b90e623a1ade3ee53e53bdf7ea1b2e1cccfe2d
|


