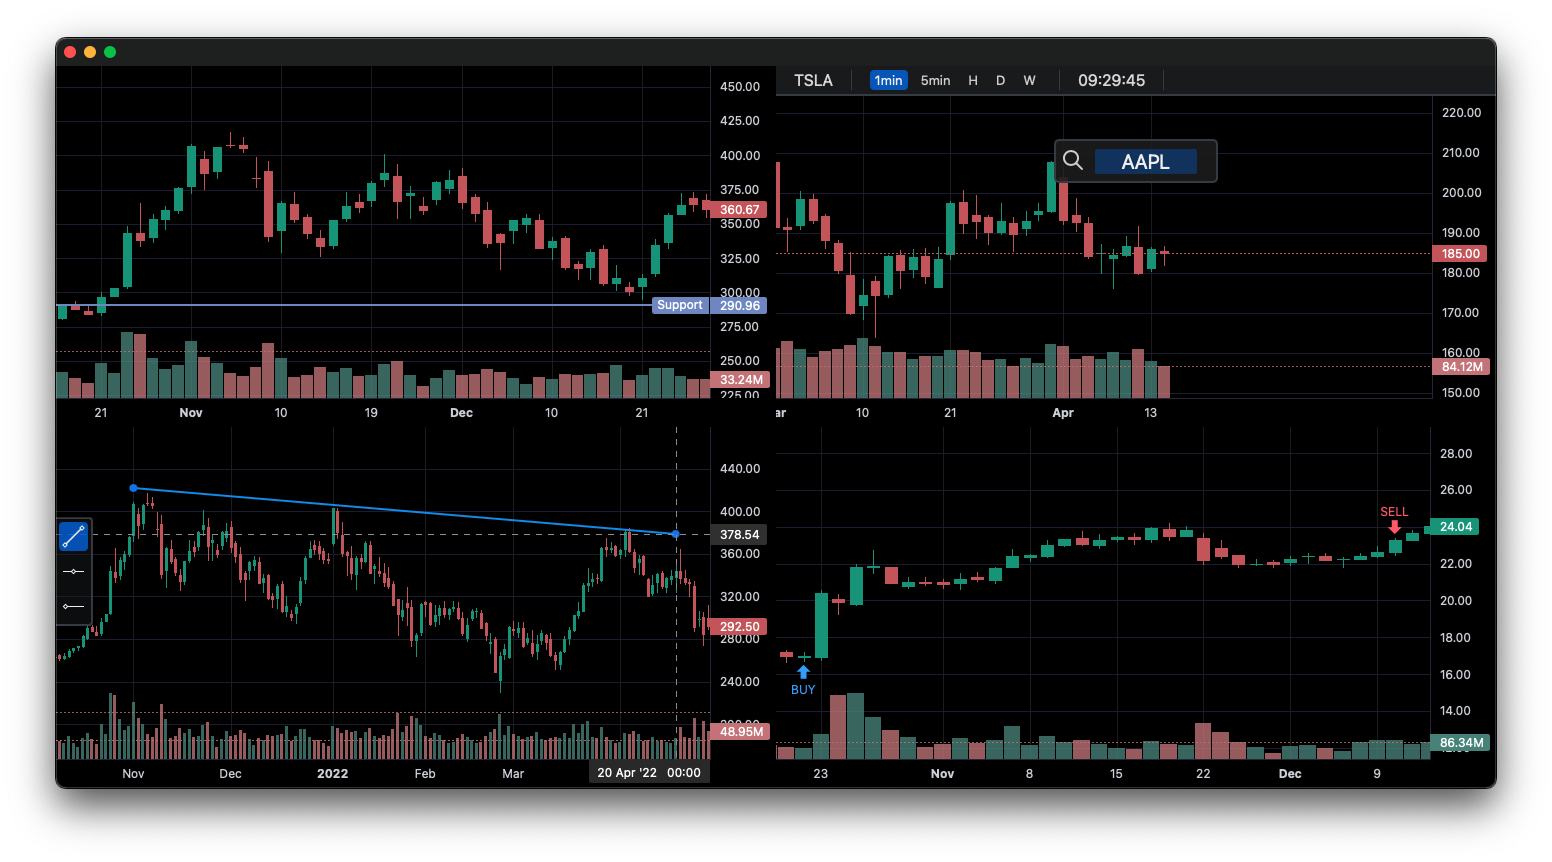
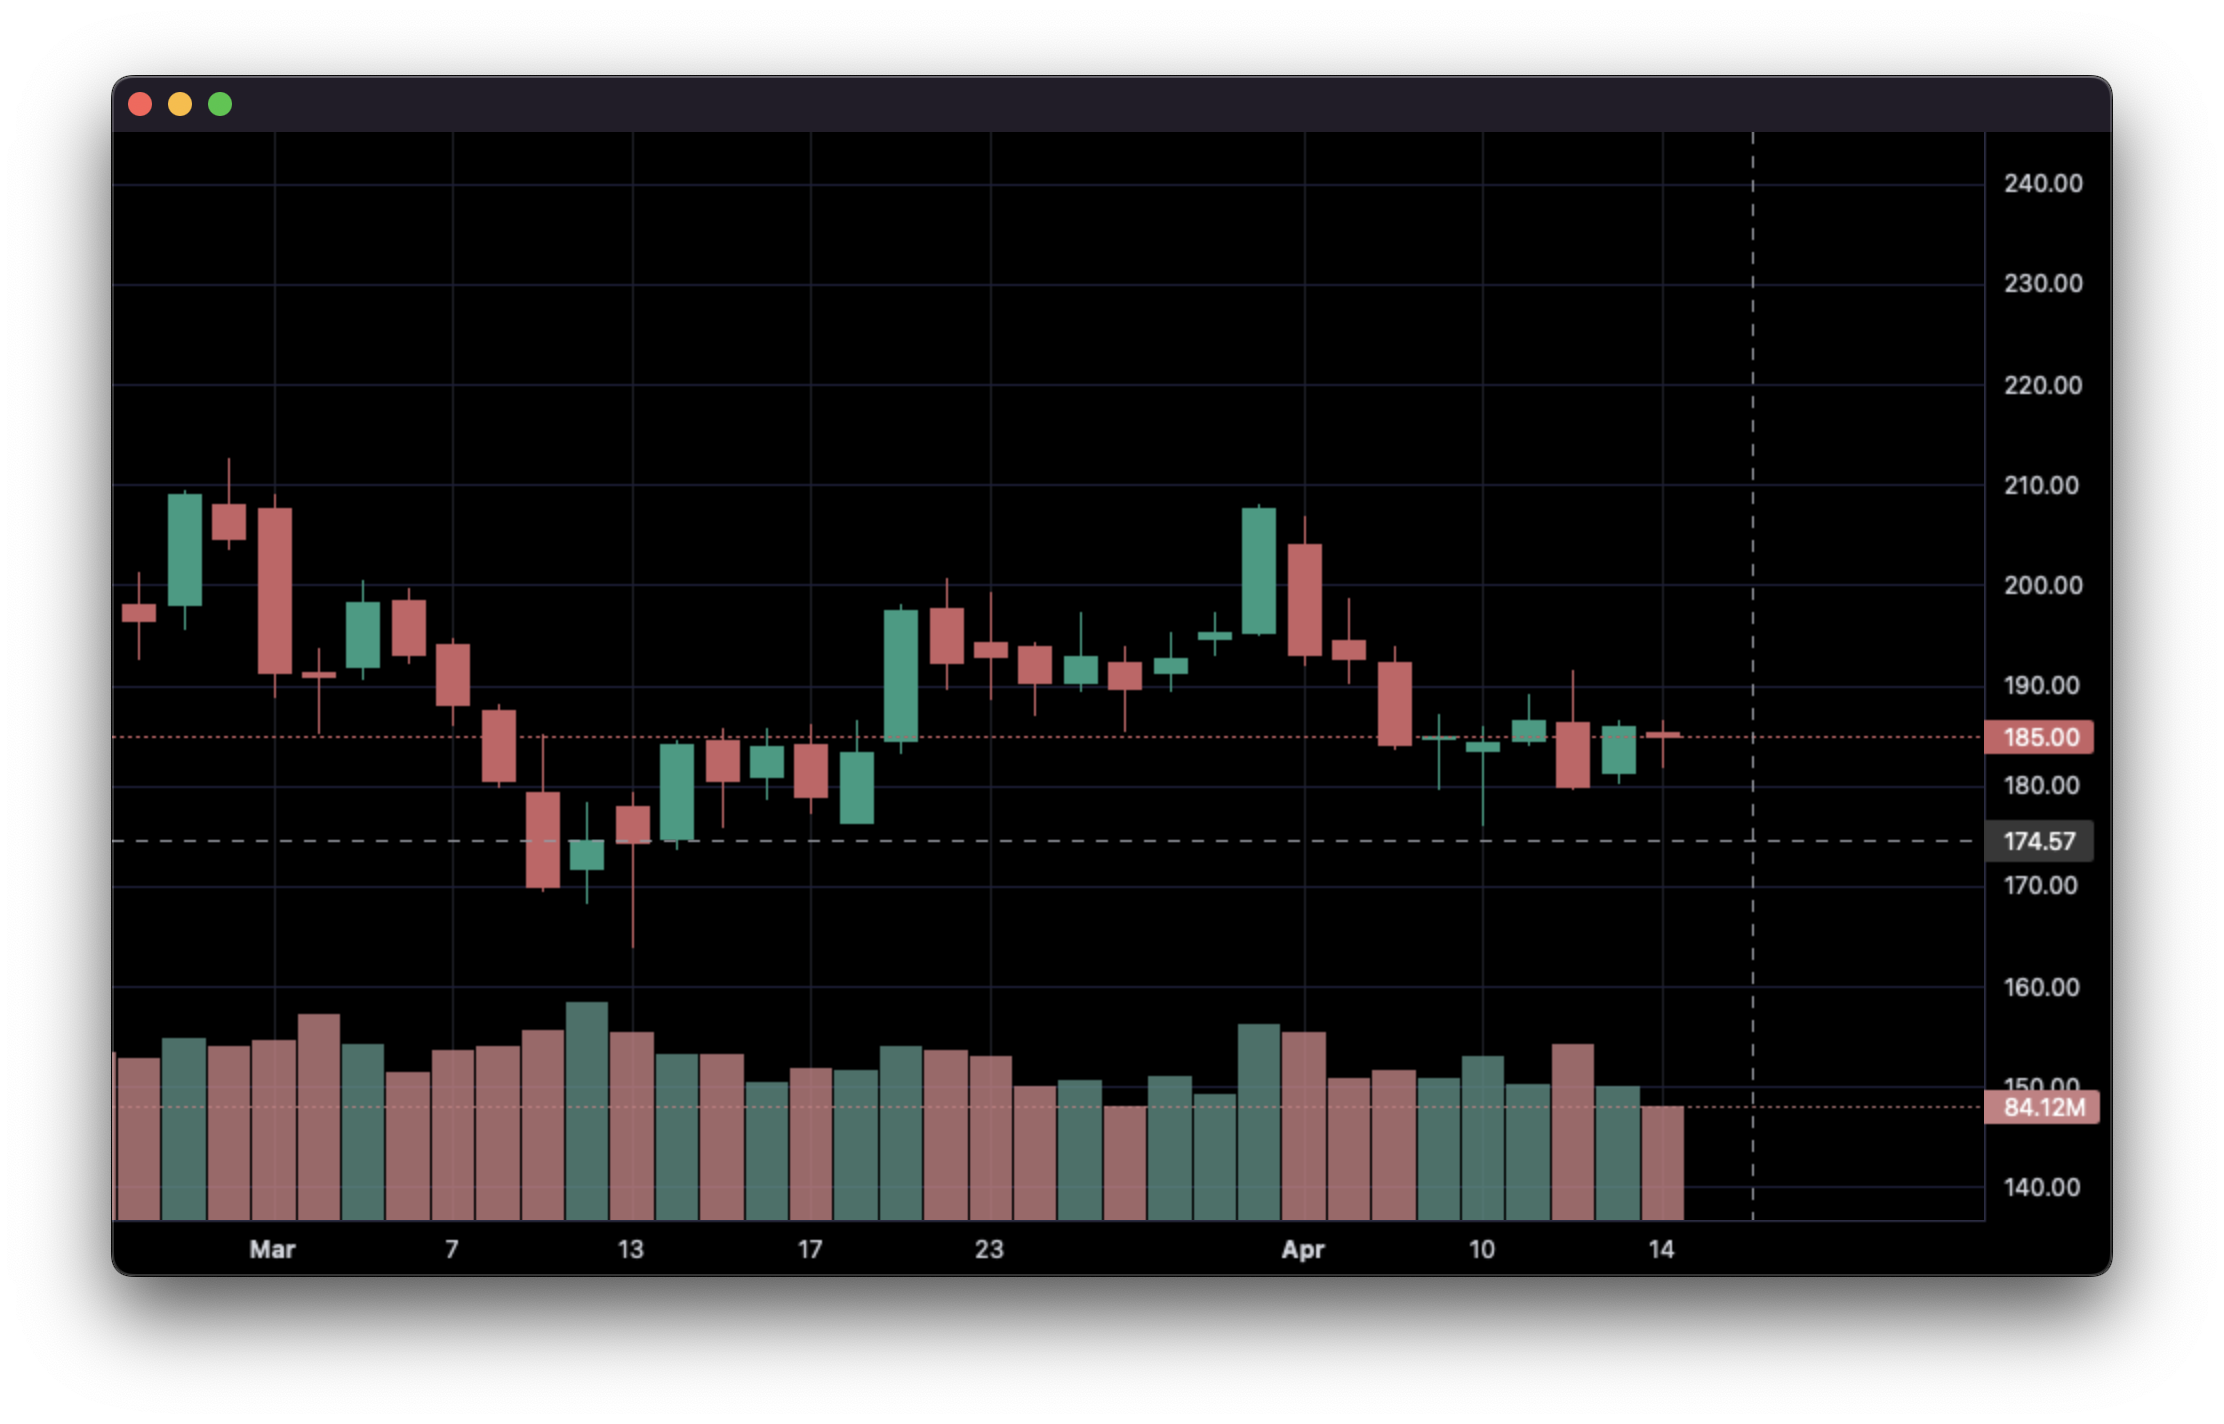
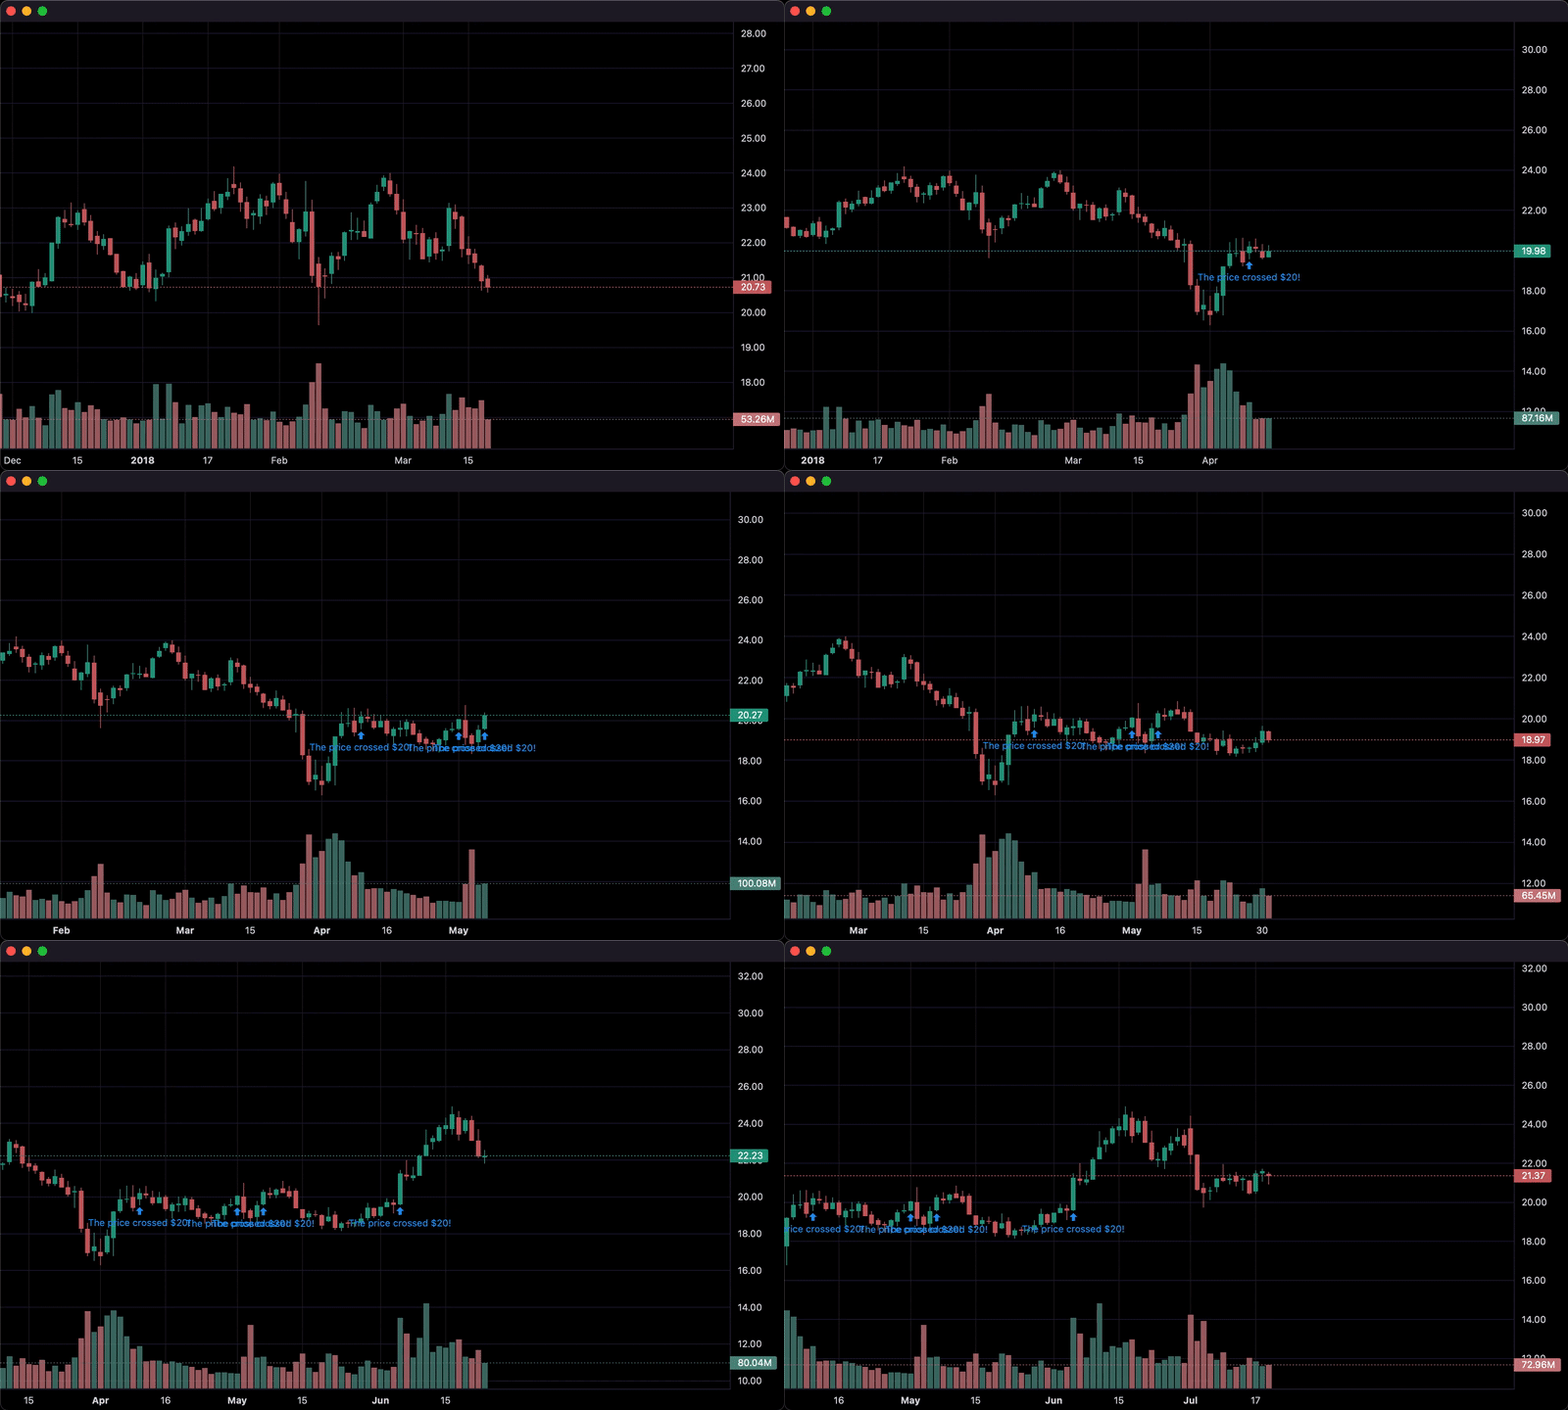
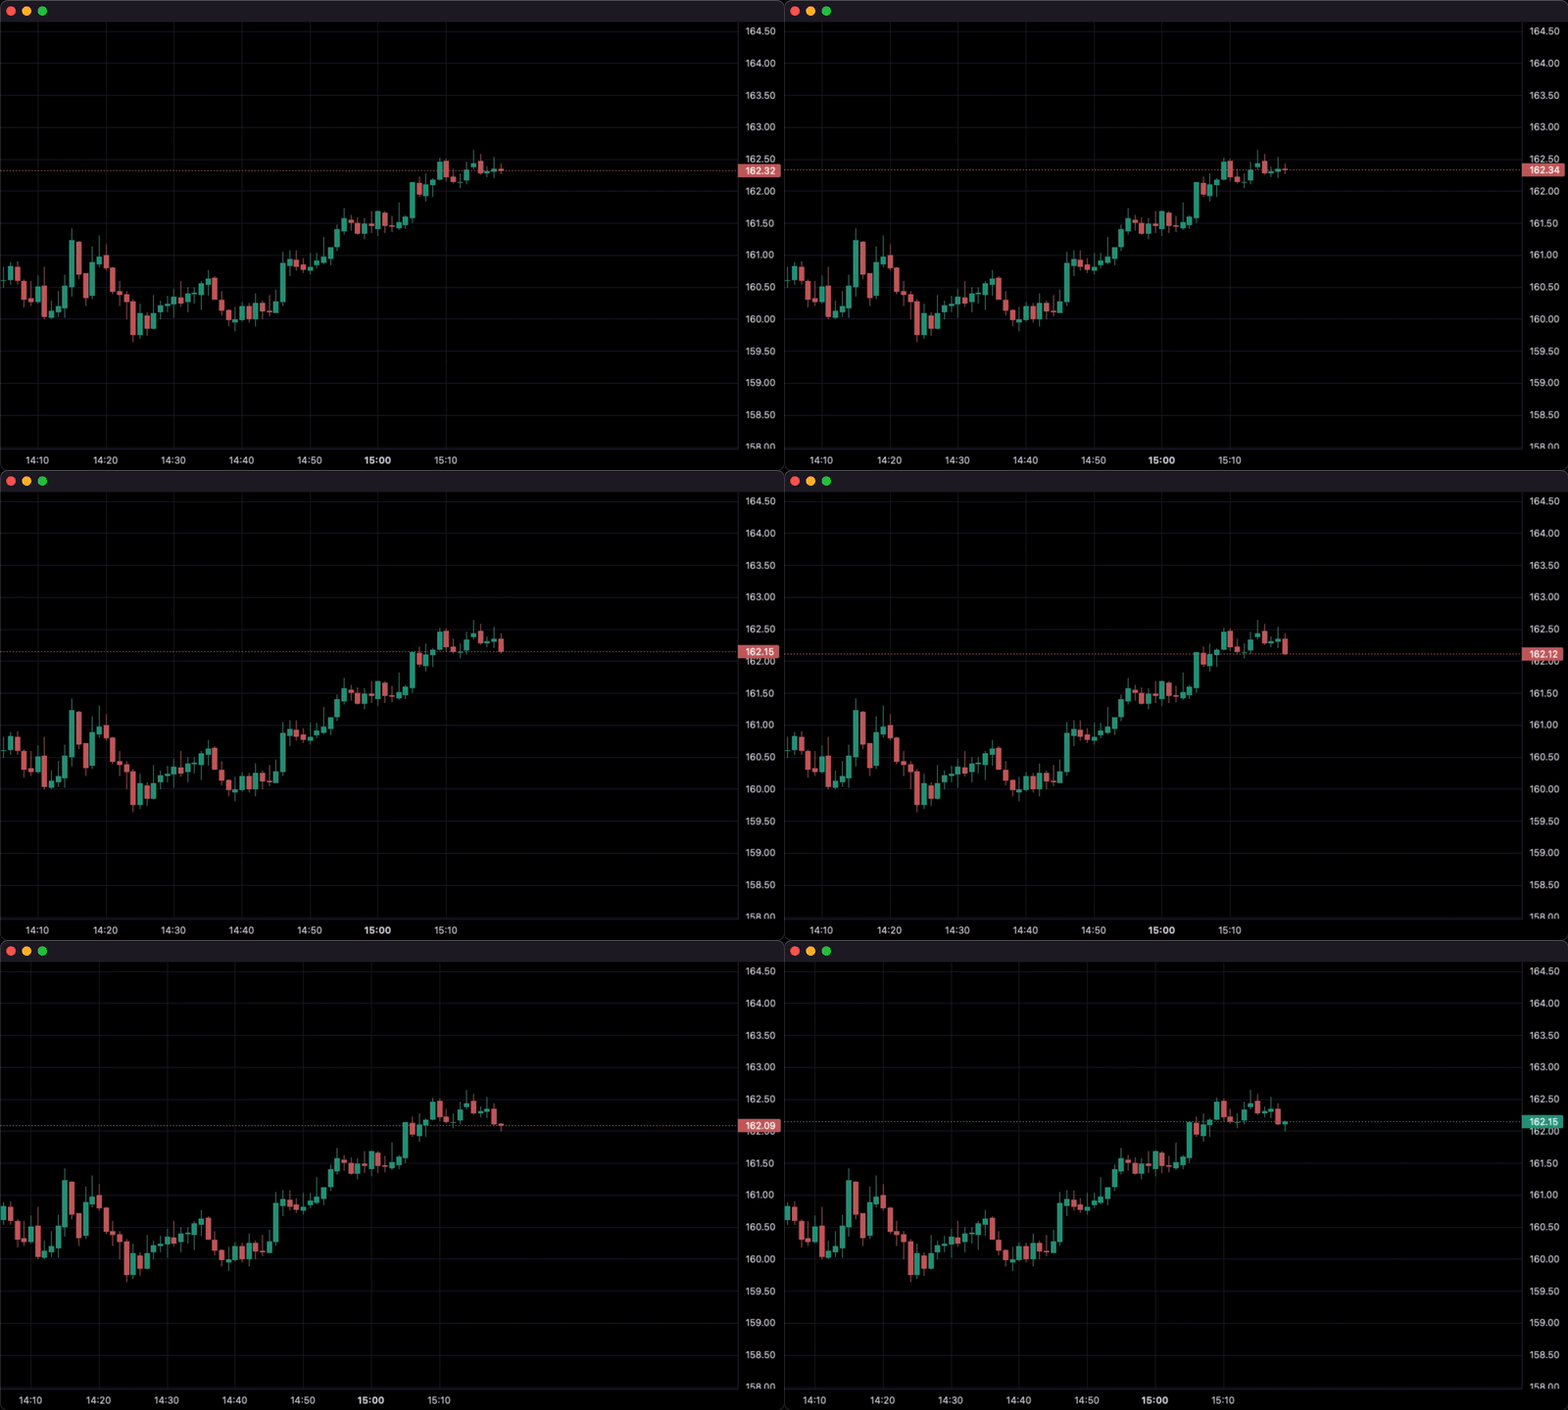
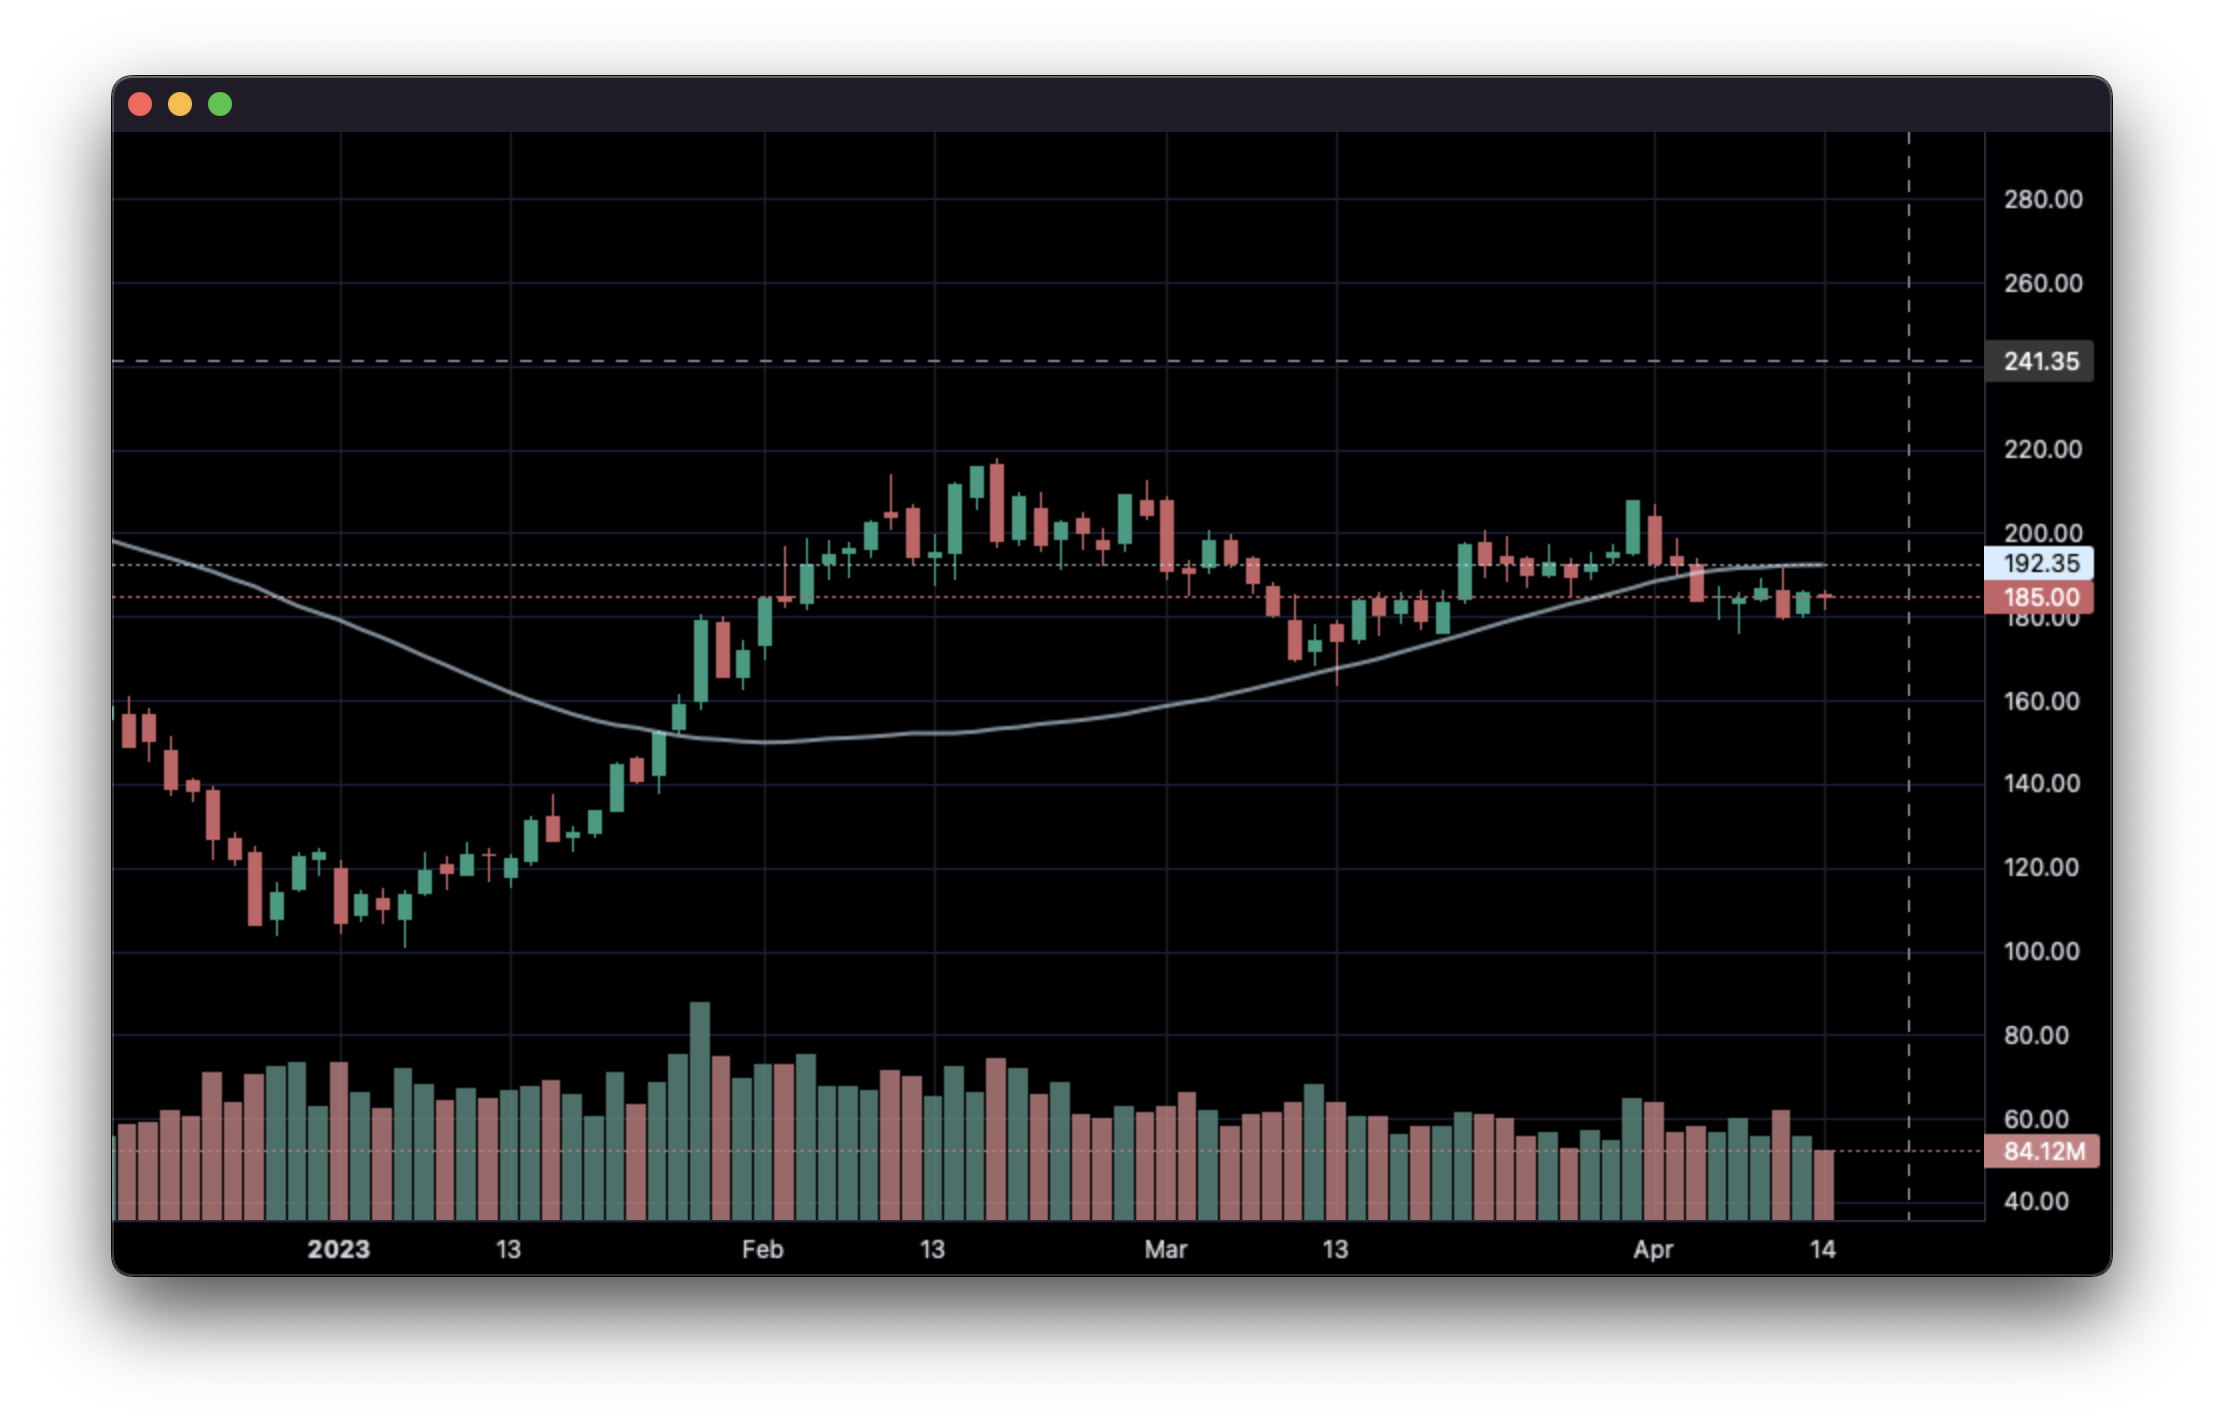
Python framework for TradingView's Lightweight Charts JavaScript library.
Reason this release was yanked:
bug; setup.py needs updating
Project description
lightweight-charts-python
lightweight-charts-python aims to provide a simple and pythonic way to access and implement TradingView's Lightweight Charts.
Installation
pip install lightweight-charts
- White screen? Having issues with pywebview? Click here.
Features
- Simple and easy to use.
- Blocking or non-blocking GUI.
- Streamlined for live data, with methods for updating directly from tick data.
- Supports: Jupyter Notebooks, PyQt, wxPython, Streamlit, and asyncio.
- Callbacks allowing for timeframe (1min, 5min, 30min etc.) selectors, searching, and more.
- Multi-Pane Charts using the
SubChart. - Direct integration of market data through Polygon.io's market data API.
1. Display data from a csv:
import pandas as pd
from lightweight_charts import Chart


if __name__ == '__main__':

    chart = Chart()

    # Columns: | time | open | high | low | close | volume (if volume is enabled) |
    df = pd.read_csv('ohlcv.csv')
    chart.set(df)

    chart.show(block=True)
2. Updating bars in real-time:
import pandas as pd
from time import sleep
from lightweight_charts import Chart

if __name__ == '__main__':

    chart = Chart()

    df1 = pd.read_csv('ohlcv.csv')
    df2 = pd.read_csv('next_ohlcv.csv')

    chart.set(df1)

    chart.show()

    last_close = df1.iloc[-1]

    for i, series in df2.iterrows():
        chart.update(series)

        if series['close'] > 20 and last_close < 20:
            chart.marker(text='The price crossed $20!')

        last_close = series['close']
        sleep(0.1)
3. Updating bars from tick data in real-time:
import pandas as pd
from time import sleep
from lightweight_charts import Chart


if __name__ == '__main__':

    df1 = pd.read_csv('ohlc.csv')

    # Columns: | time | price | volume (if volume is enabled) |
    df2 = pd.read_csv('ticks.csv')

    chart = Chart(volume_enabled=False)

    chart.set(df1)

    chart.show()

    for i, tick in df2.iterrows():
        chart.update_from_tick(tick)

        sleep(0.3)
4. Line Indicators:
import pandas as pd
from lightweight_charts import Chart


def calculate_sma(data: pd.DataFrame, period: int = 50):
   def avg(d: pd.DataFrame):
      return d['close'].mean()

   result = []
   for i in range(period - 1, len(data)):
      val = avg(data.iloc[i - period + 1:i])
      result.append({'time': data.iloc[i]['date'], 'value': val})
   return pd.DataFrame(result)


if __name__ == '__main__':
   chart = Chart()

   df = pd.read_csv('ohlcv.csv')
   chart.set(df)

   line = chart.create_line()
   sma_data = calculate_sma(df)
   line._set(sma_data)

   chart.show(block=True)
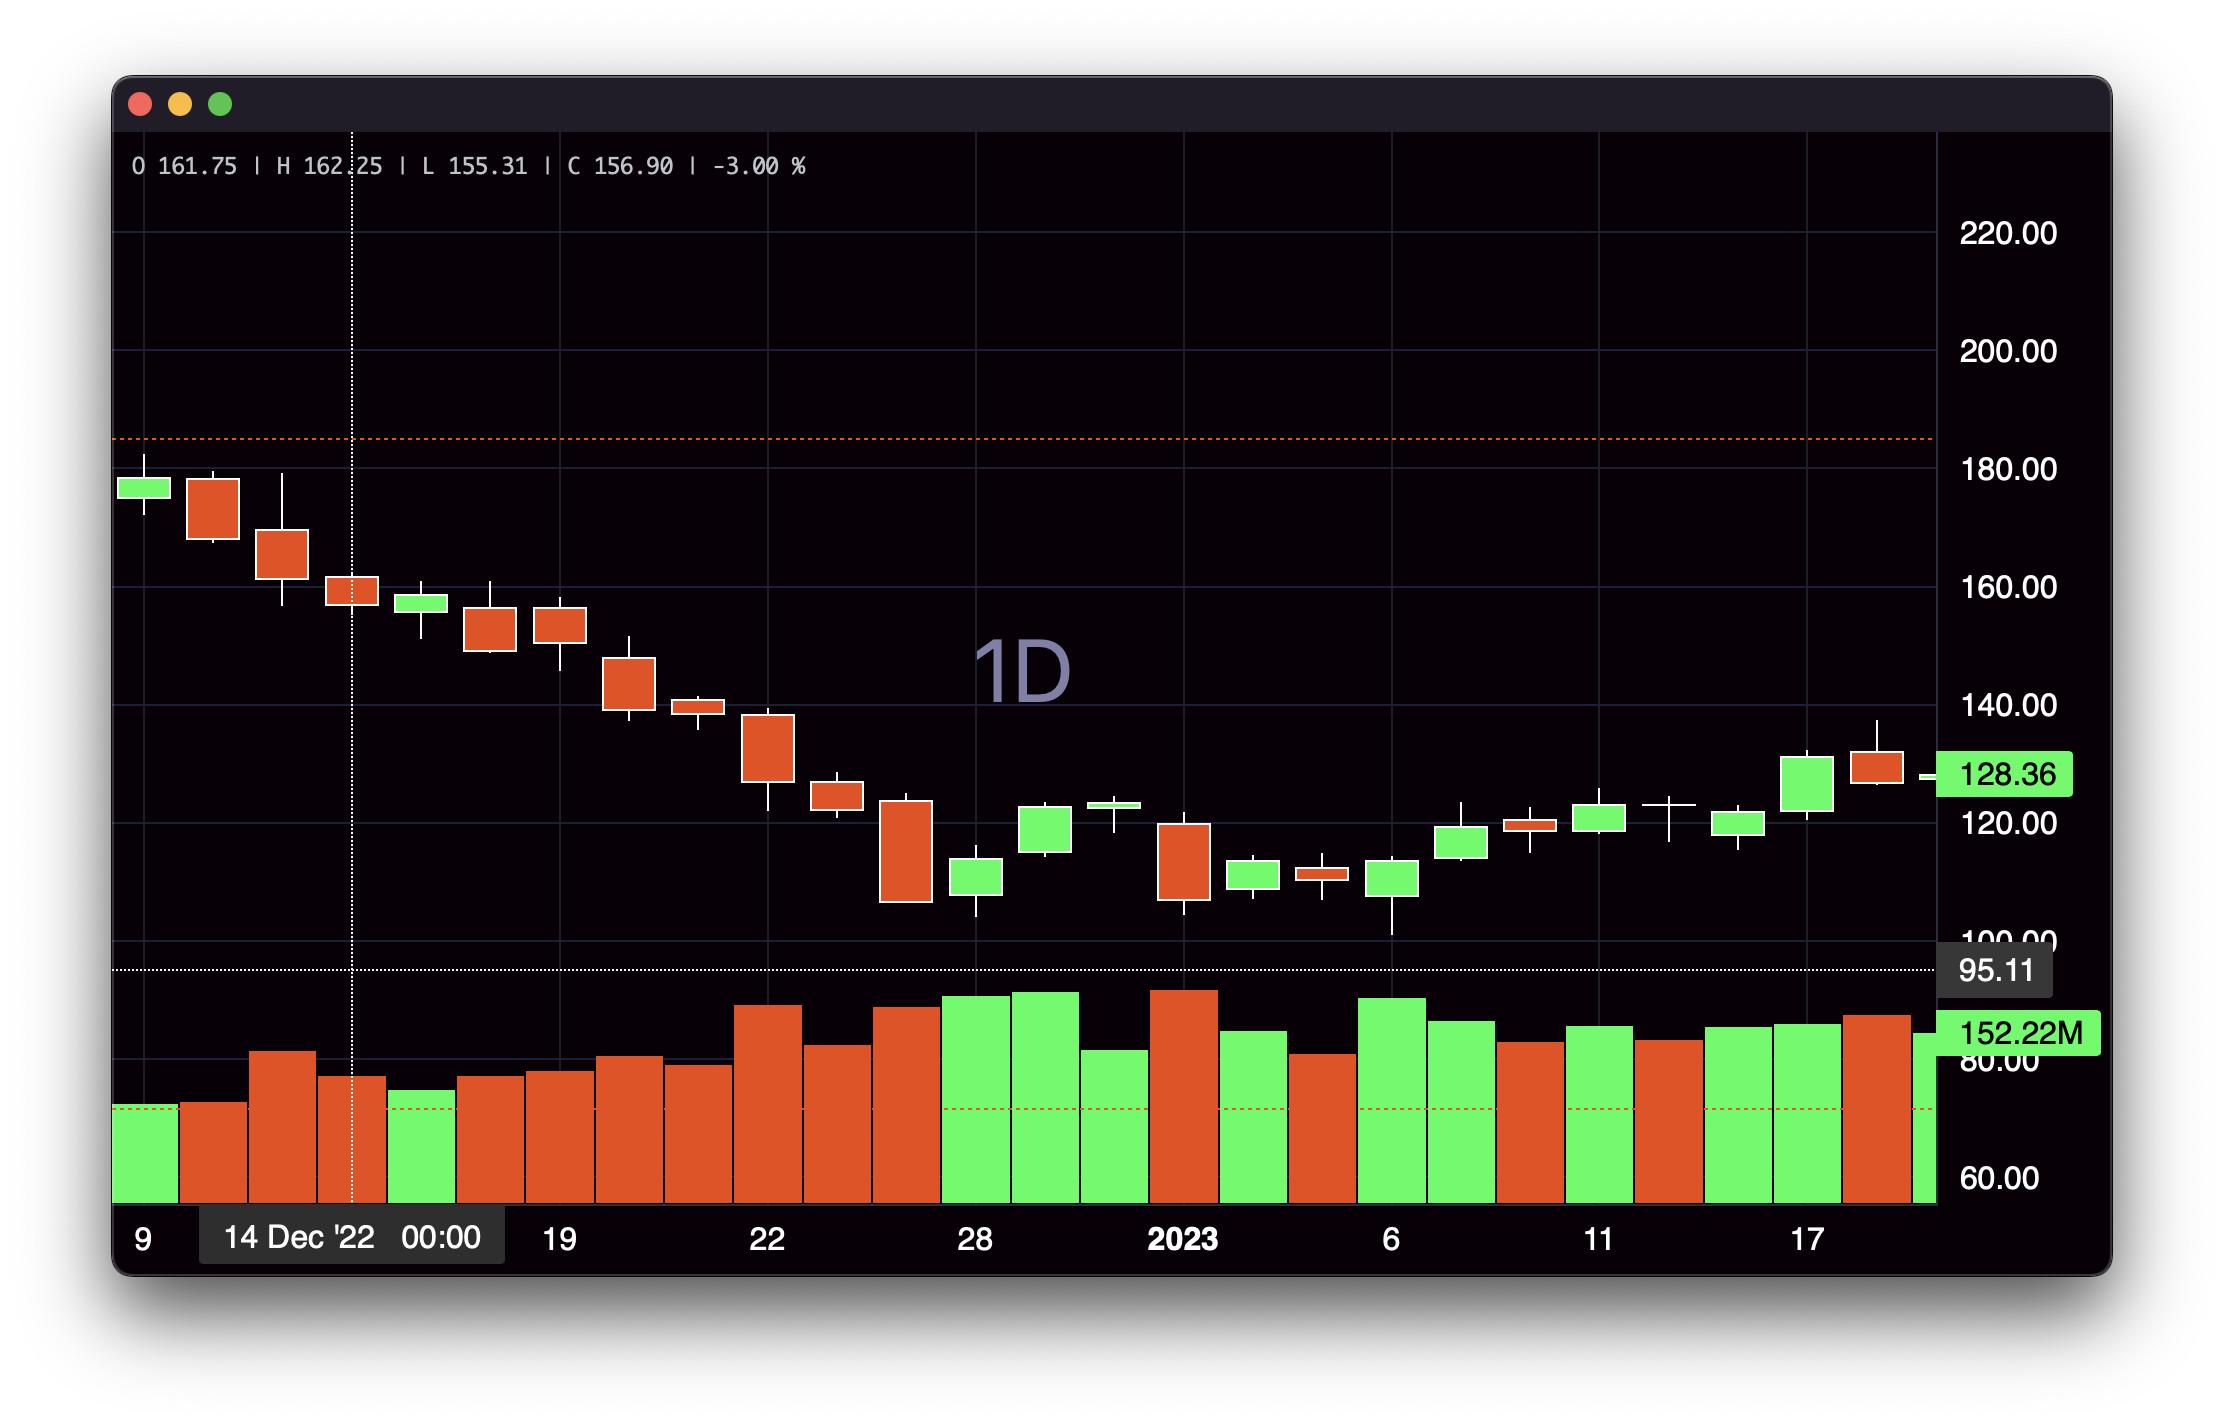
5. Styling:
import pandas as pd
from lightweight_charts import Chart


if __name__ == '__main__':

    chart = Chart(debug=True)

    df = pd.read_csv('ohlcv.csv')

    chart.layout(background_color='#090008', text_color='#FFFFFF', font_size=16,
                 font_family='Helvetica')

    chart.candle_style(up_color='#00ff55', down_color='#ed4807',
                       border_up_color='#FFFFFF', border_down_color='#FFFFFF',
                       wick_up_color='#FFFFFF', wick_down_color='#FFFFFF')

    chart.volume_config(up_color='#00ff55', down_color='#ed4807')

    chart.watermark('1D', color='rgba(180, 180, 240, 0.7)')

    chart.crosshair(mode='normal', vert_color='#FFFFFF', vert_style='dotted',
                    horz_color='#FFFFFF', horz_style='dotted')

    chart.legend(visible=True, font_size=14)

    chart.set(df)

    chart.show(block=True)
6. Callbacks:
import asyncio
import pandas as pd

from lightweight_charts import Chart


def get_bar_data(symbol, timeframe):
    if symbol not in ('AAPL', 'GOOGL', 'TSLA'):
        print(f'No data for "{symbol}"')
        return pd.DataFrame()
    return pd.read_csv(f'bar_data/{symbol}_{timeframe}.csv')


class API:
    def __init__(self):
        self.chart = None  # Changes after each callback.

    async def on_search(self, searched_string):  # Called when the user searches.
        new_data = get_bar_data(searched_string, self.chart.topbar['timeframe'].value)
        if new_data.empty:
            return
        self.chart.topbar['corner'].set(searched_string)
        self.chart.set(new_data)

    async def on_timeframe_selection(self):  # Called when the user changes the timeframe.
        new_data = get_bar_data(self.chart.topbar['corner'].value, self.chart.topbar['timeframe'].value)
        if new_data.empty:
            return
        self.chart.set(new_data)


async def main():
    api = API()

    chart = Chart(api=api, topbar=True, searchbox=True)
    chart.legend(True)

    chart.topbar.textbox('corner', 'TSLA')
    chart.topbar.switcher('timeframe', api.on_timeframe_selection, '1min', '5min', '30min', default='5min')

    df = get_bar_data('TSLA', '5min')
    chart.set(df)

    await chart.show_async(block=True)


if __name__ == '__main__':
    asyncio.run(main())
Project details
Release history Release notifications | RSS feed
Download files
Download the file for your platform. If you're not sure which to choose, learn more about installing packages.
Source Distribution
lightweight_charts-1.0.13.tar.gz
(22.5 kB
view details)
Built Distribution
File details
Details for the file lightweight_charts-1.0.13.tar.gz.
File metadata
- Download URL: lightweight_charts-1.0.13.tar.gz
- Upload date:
- Size: 22.5 kB
- Tags: Source
- Uploaded using Trusted Publishing? No
- Uploaded via: twine/4.0.2 CPython/3.10.2
File hashes
| Algorithm | Hash digest | |
|---|---|---|
| SHA256 | e33234b80306eb40c6c88259aa22ae6c5b21ccd4ab50c93a37b099a5a3211398 |
|
| MD5 | 18e37b89fbfbaa9ae737d8776e23658d |
|
| BLAKE2b-256 | 0e501330459e77c3e39a54b48c8b0edc185f33120dbaac3d0962344cb6bfc0b8 |
File details
Details for the file lightweight_charts-1.0.13-py3-none-any.whl.
File metadata
- Download URL: lightweight_charts-1.0.13-py3-none-any.whl
- Upload date:
- Size: 22.7 kB
- Tags: Python 3
- Uploaded using Trusted Publishing? No
- Uploaded via: twine/4.0.2 CPython/3.10.2
File hashes
| Algorithm | Hash digest | |
|---|---|---|
| SHA256 | 9d56847de15a2eb52068a2a9060f11a8e74e4096babe6faf3ef1aba7d447b96d |
|
| MD5 | 0d29b9712323de21db11bbe19c5b29ca |
|
| BLAKE2b-256 | b4f01298992ed8352cb0956a79b6f3d103a221079b738085046d0ccdb440a940 |


