linder is a machine-learning based land use/land cover (LULC) classifier using Sentinel imagery.
Project description
LINDER: Land use INDexER
A pipeline for calculating land cover over urban/rural areas.
How to use?
A quick demo:
from pathlib import Path
import linder as ld

# get a list of CSV files of calculated land cover fractions of all downloaded images
list_path_fraction = ld.get_land_cover(
    51.515070,
    -0.008555,
    51.489564,
    0.034932,
    "2016-01-01",
    "2017-10-01",
    path_GUF="Data/GUF/WSF2015_v1_EPSG4326/WSF2015_v1_EPSG4326",
    path_save=Path("~/Downloads/linder_res").expanduser(),
)

# synthesise the above results to one `DataFrame`
df_lc = ld.proc_fraction(list_path_fraction)
Required libraries
Grass
for macOS, download and install the grass package:
http://grassmac.wikidot.com/downloads
other python libraries
use conda to create a fresh environment for this pipeline:
conda env create -f GDAL.yml
Dependency details refer to GDAL.yml.
Dependency datasets
nc_spm_08 dataset
This dataset includes projection files required by GRASS.
download it here.
GUF dataset (optional)
GUF (Global Urban Footprint) is a global urban coverage dataset produced by DLR.
This pipeline use GUF to improve accuracy in predicting urban features.
configuration
sentinel-hub
refer to this page for setting up a new configuration.
Then update the sentinelhub instance ID as follows:
sentinelhub.config --instance_id [your-instance-ID]
details
This is a pipeline for calculating the landcover over desired regions. It includes:
-
Step 1: Getting the location of the region (
latandlon) -
Step 2: Getting the satellite image for the desired region
-
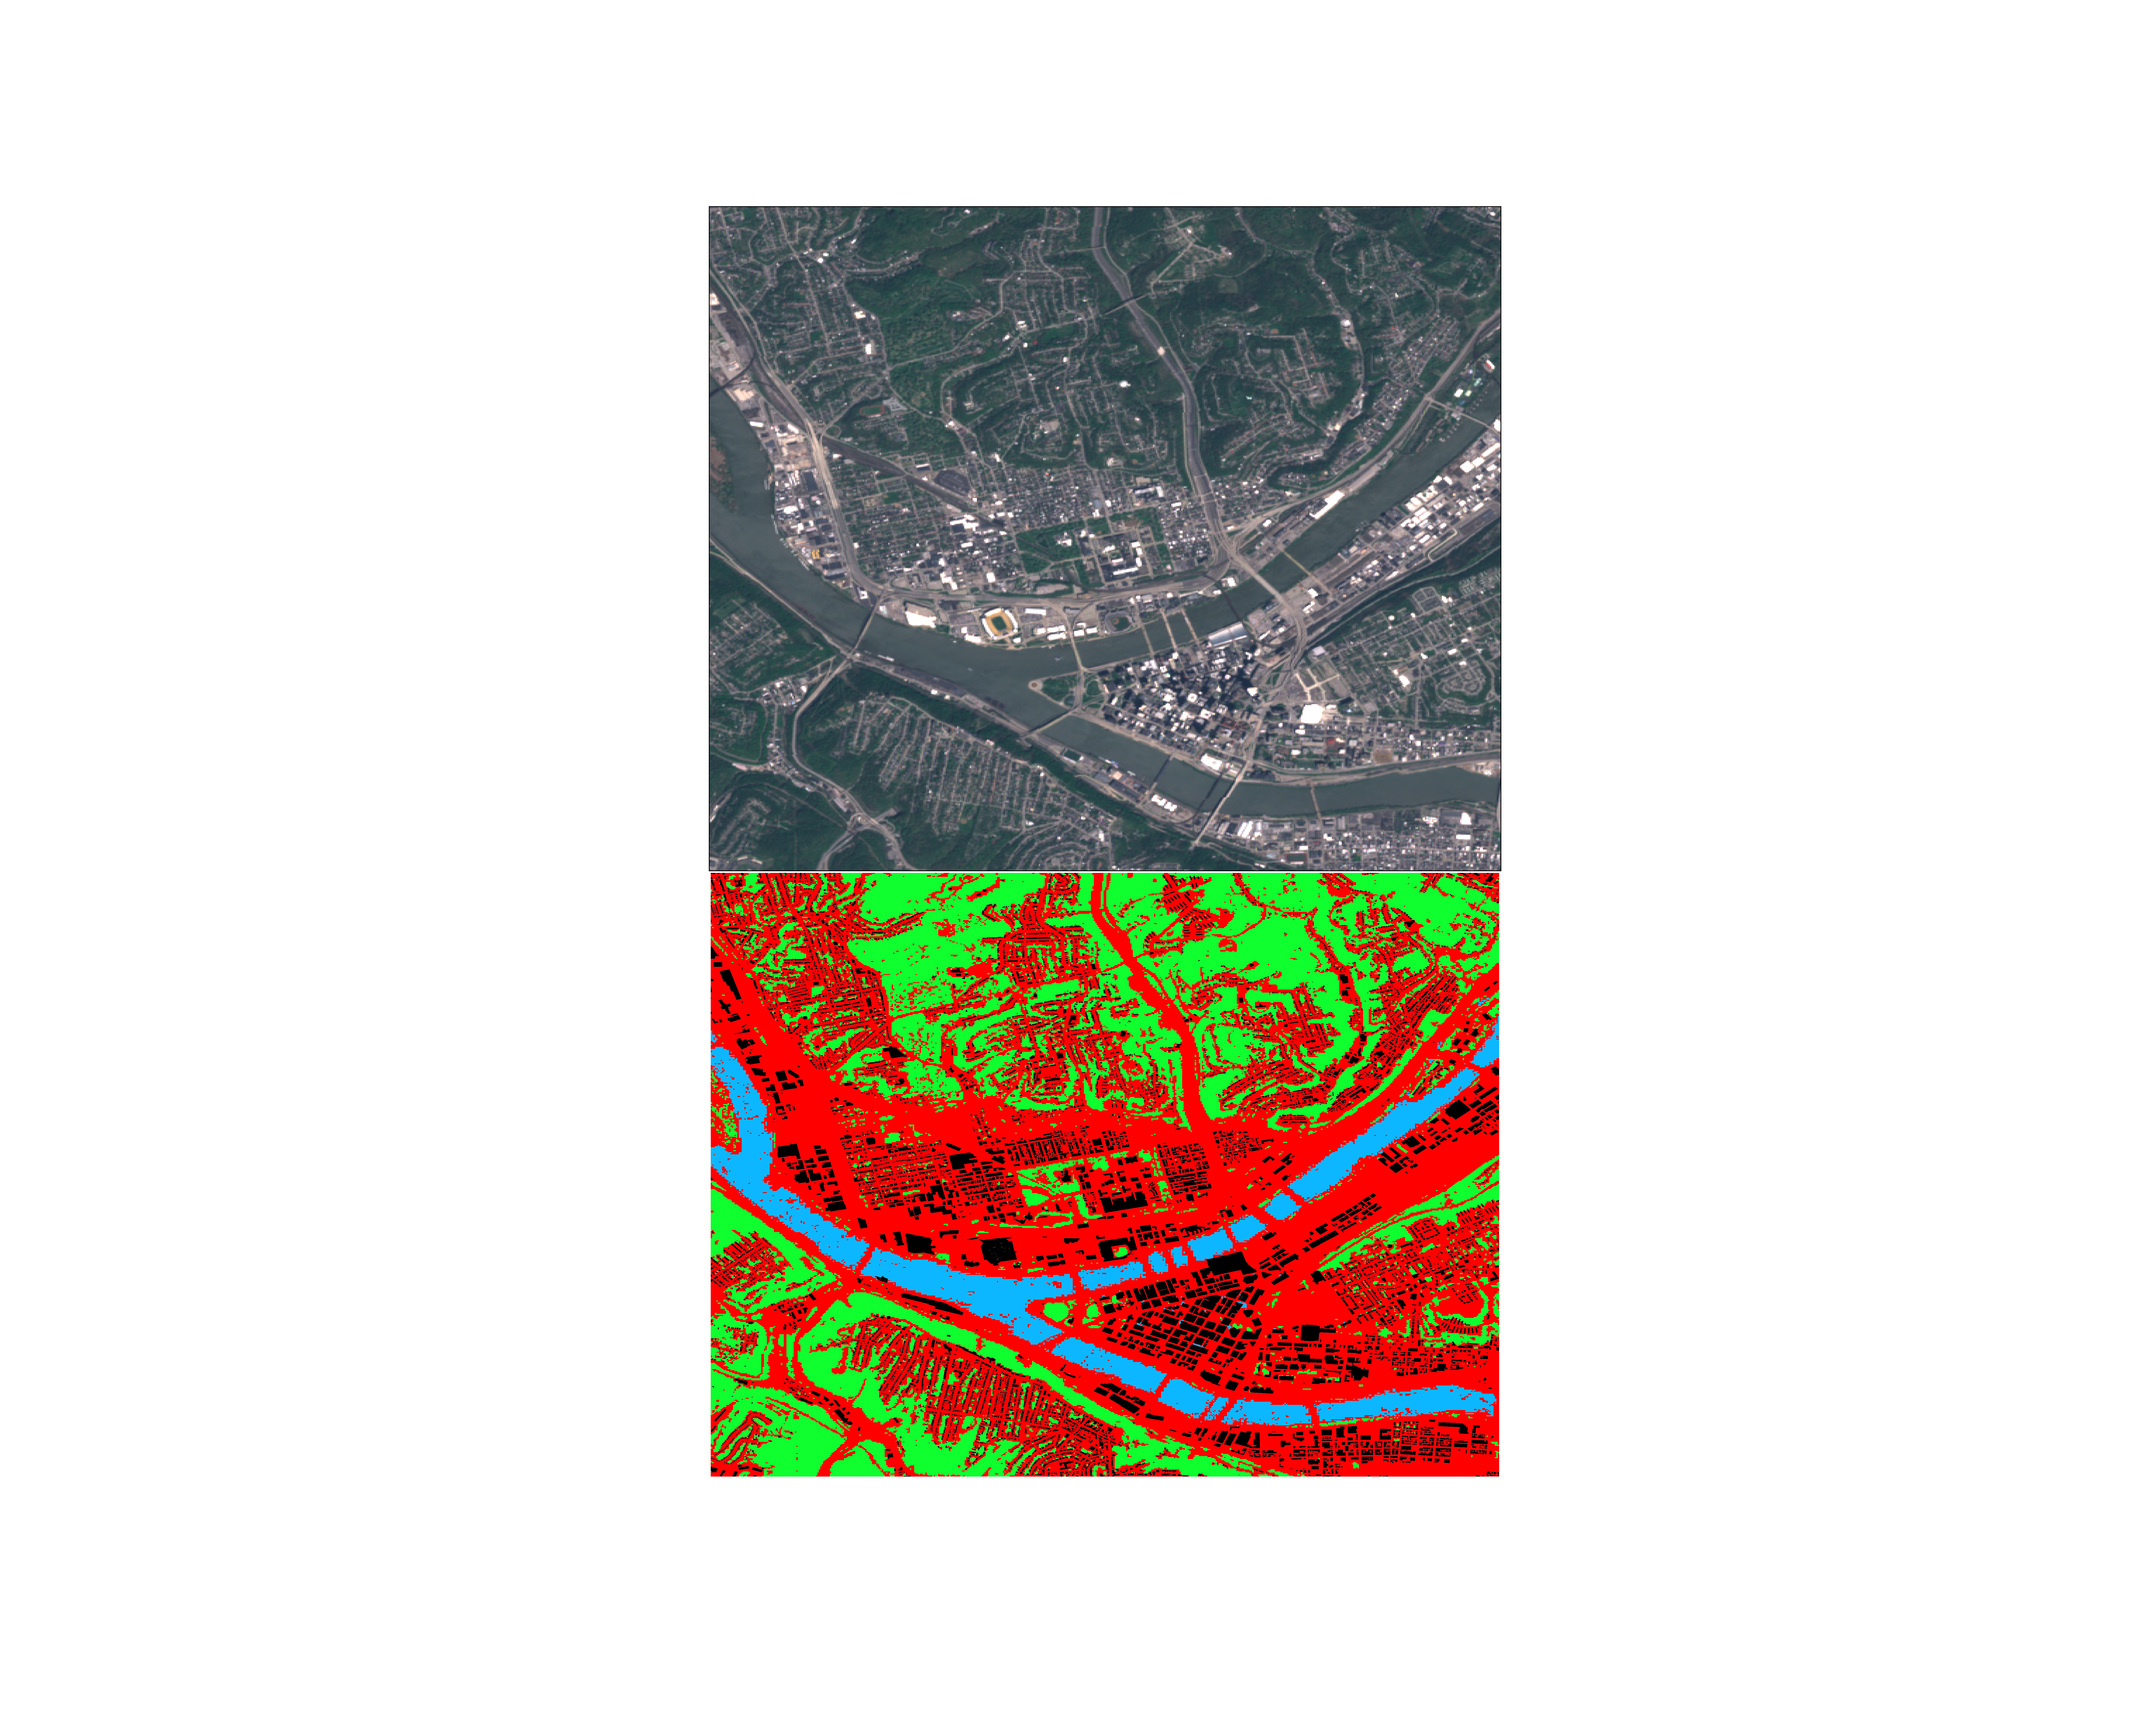
Step 3: Prediction of the land cover into 3 categories:
- 1-Urban
- 2-Green
- 3-Water and
- 4-other
-
Step 4: Overlaying the GUF data into the prediction. Therefore the landcover becomes 1-Water 2-Green 3-Urban 4-Other
-
Step 5: Overlaying the building data from OSM or Microsoft data (only for the US). Therefore, the final land cover includes 1-Water 2-Green 3-Buildings 4-Paved 5-Others
Using this pipeline is as simple as choosing the coordinates, and providing the GUF data and/or building data. The user can choose which data is available. For example, in the case of no GUF data, the pipeline uses the prediction, or in the case of no Microsoft data, the pipeline uses the OSM data for buildings. Note that adding GUF data makes the final result of the landcover more accurate.
Some technical details:
-
Merging various maps might be very computationally expensive, and the current Python packages like GDAL are not very efficient. The pipeline instead uses a python interface to use GRASS functions (such as
v.overlay) directly to speed up the merging processes. -
The pipeline uses a pre-trained model to predict the land cover. Currently, the model is trained over Colombo, but various tests has shown it has a good performance on other places as well. A more sophisticated model can be trained by using more datasets.
-
Note that while OSM data are automatically fetched from the website for the desired region, the Microsoft data need to be downloaded for the chosen location manually. This can be automated in the future.
Some examples
Colombo, Sri Lanka
Pittsburgh, United States
Project details
Release history Release notifications | RSS feed
Download files
Download the file for your platform. If you're not sure which to choose, learn more about installing packages.
Source Distributions
Built Distribution
Hashes for linder-2020.6.3.2-py3-none-any.whl
| Algorithm | Hash digest | |
|---|---|---|
| SHA256 | 69ade88a8e80c1a7d875d6c79b5e2cfb5d33d1ea7f6d381cbaed08a83505b65c |
|
| MD5 | f07c2f2e694b28b487d19eb664a45695 |
|
| BLAKE2b-256 | 35314c985351ffc5524a80c5ae232c33dd98bffa04c40593bfab900a23dbe36c |


