Report locust metrics to influxdb.
Project description
locust_influx
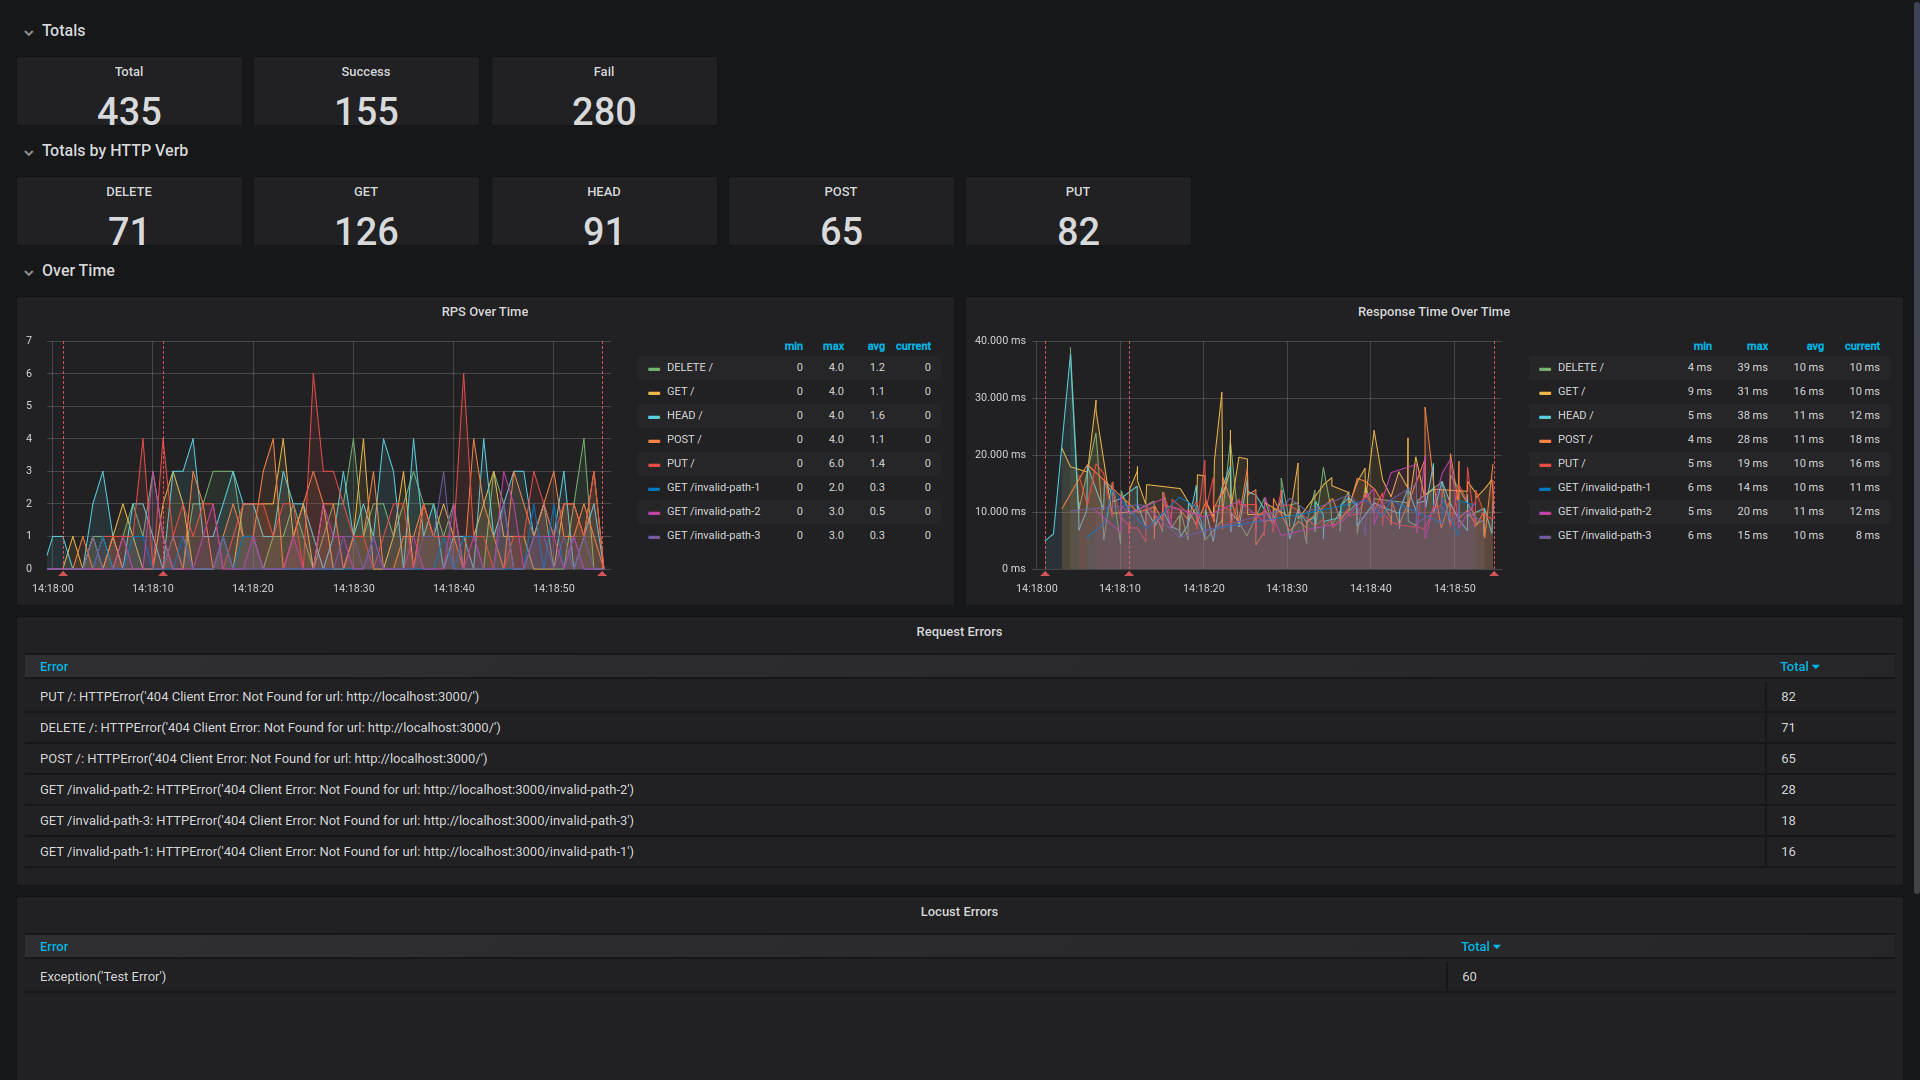
Send information about locust requests to InfluxDB and follow the progress through Grafana charts.
Test and taste it locally
Start an InfluxDB container locally:
docker run -d --name influxdb -d -p 8086:8086
Start a Grafana container locally:
docker run -d --name grafana -d -p 3000:3000
Crete a new python virtual environment and install locust_influx:
pip install locust_influx
Run the example locustfile contained in this repo (Change the host to point to desired one):
locust -f ./locustfile.py --no-web --clients 10 --hatch-rate 1 --run-time 60s --host http://localhost:8080
Open your local Grafana in the browser at http://localhost:3000/
Import the example dashboard from locust_dashboard.json file.
Project details
Release history Release notifications | RSS feed
Download files
Download the file for your platform. If you're not sure which to choose, learn more about installing packages.


