Process live and historical data from luftdaten.info, IRCELINE and OpenAQ. Filter by station-id, sensor-id and sensor-type, apply reverse geocoding, store into time-series and RDBMS databases, publish to MQTT, output as JSON, or visualize in Grafana.

Project description


Luftdatenpumpe


About
Process live and historical data from luftdaten.info, irceline and OpenAQ. Filter by station-id, sensor-id and sensor-type, apply reverse geocoding, store into TSDB and RDBMS databases (InfluxDB and PostGIS), publish to MQTT or just output as JSON.

Features
Luftdatenpumpe acquires the measurement readings either from the livedata API of luftdaten.info or from its archived CSV files published to archive.luftdaten.info. To minimize impact on the upstream servers, all data gets reasonably cached.
While iterating the readings, it optionally filters on station-id, sensor-id or sensor-type and restrains information processing to the corresponding stations and sensors.
Then, each station’s location information gets enhanced by
attaching its geospatial position as a Geohash.
attaching a synthetic real-world address resolved using the reverse geocoding service Nominatim by OpenStreetMap.
Information about stations can be
displayed on STDOUT or STDERR in JSON format.
filtered and transformed interactively through jq, the swiss army knife of JSON manipulation.
stored into RDBMS databases like PostgreSQL using the fine dataset package. Being built on top of SQLAlchemy, this supports all major databases.
queried using advanced geospatial features when running PostGIS, please follow up reading the Luftdatenpumpe PostGIS tutorial.
Measurement readings can be
Synopsis
# List networks
luftdatenpumpe networks

# List LDI stations
luftdatenpumpe stations --network=ldi --station=49,1033 --reverse-geocode

# Store list of LDI stations and metadata into RDBMS database (PostgreSQL), also display on STDERR
luftdatenpumpe stations --network=ldi --station=49,1033 --reverse-geocode --target=postgresql://luftdatenpumpe@localhost/weatherbase

# Store LDI readings into InfluxDB
luftdatenpumpe readings --network=ldi --station=49,1033 --target=influxdb://luftdatenpumpe@localhost/luftdaten_info

# Forward LDI readings to MQTT
luftdatenpumpe readings --network=ldi --station=49,1033 --target=mqtt://mqtt.example.org/luftdaten.info
For a full overview about all program options including meaningful examples, you might just want to run luftdatenpumpe --help on your command line or visit luftdatenpumpe –help.
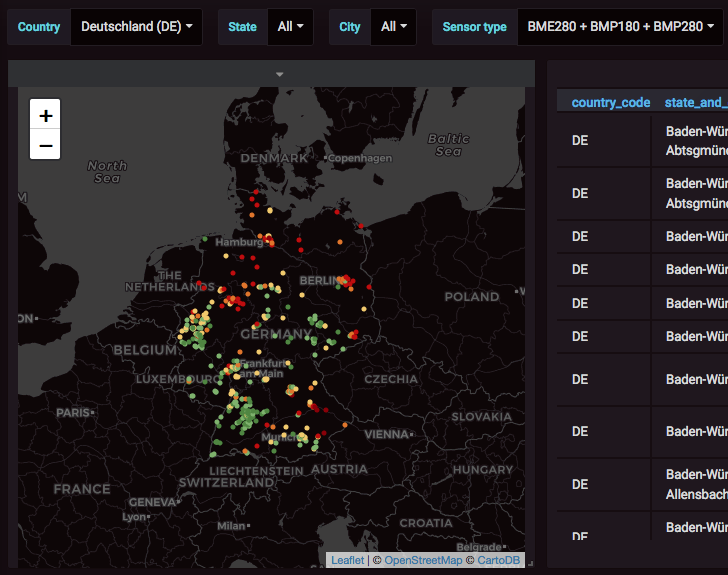
Screenshots
Luftdaten-Viewer displays stations and measurements from luftdaten.info (LDI) in Grafana.
Map display and filtering
Filter by different synthesized address components and sensor type.
Display measurements from filtered stations on Grafana Worldmap Panel.
Display filtered list of stations with corresponding information in tabular form.
Measurement values are held against configured thresholds so points are colored appropriately.
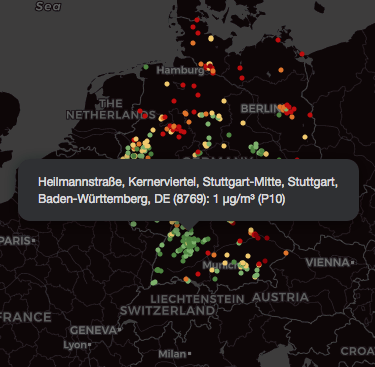
Map popup labels
Humanized label computed from synthesized OpenStreetMap address.
Numeric station identifier.
Measurement value, unit and field name.
Installation
If you are running Python 3 already, installing the program should be as easy as:
pip install luftdatenpumpe
At this point, you should be able to conduct simple tests like luftdatenpumpe stations as seen in the synopsis section above. At least, you should verify the installation succeeded by running:
luftdatenpumpe --version
However, you might have to resolve some prerequisites so you want to follow the detailed installation instructions at install Luftdatenpumpe.
Luftdaten-Viewer
About
Using Luftdatenpumpe, you can build user-friendly interactive GIS systems on top of PostGIS, InfluxDB and Grafana. We are calling this “Luftdaten-Viewer”.
Without further ado, you might enjoy reading about existing “Luftdaten-Viewer” installations at Testimonials for Luftdatenpumpe.
Instructions
These installation instructions outline how to setup the whole system to build similar interactive data visualization compositions of map-, graph- and other panel-widgets like outlined in the “Testimonials” section.
License
This project is licensed under the terms of the GNU AGPL license.
Content attributions
The copyright of particular images and pictograms are held by their respective owners, unless otherwise noted.
Icons and pictograms
Water Pump Free Icon from Icon Fonts is licensed by CC BY 3.0.
Release history Release notifications | RSS feed


Download files
Download the file for your platform. If you're not sure which to choose, learn more about installing packages.
Source Distribution
Built Distribution
Filter files by name, interpreter, ABI, and platform.
If you're not sure about the file name format, learn more about wheel file names.
Copy a direct link to the current filters
File details
Details for the file luftdatenpumpe-0.21.1.tar.gz.
File metadata
- Download URL: luftdatenpumpe-0.21.1.tar.gz
- Upload date:
- Size: 67.0 kB
- Tags: Source
- Uploaded using Trusted Publishing? No
- Uploaded via: twine/4.0.2 CPython/3.9.15
File hashes
| Algorithm | Hash digest | |
|---|---|---|
| SHA256 |
a2a1b839fc1fc9d7d228184ba457d251a6b081687e5e8d88bbe73480a6699954
|
|
| MD5 |
5f424a0bc7b1d5f2faebc9b56a5e2a0a
|
|
| BLAKE2b-256 |
09e5a5f0886c37fc0d8b89cb3dbb9da7766210389318e9dbb633546df4bf35ec
|
File details
Details for the file luftdatenpumpe-0.21.1-py3-none-any.whl.
File metadata
- Download URL: luftdatenpumpe-0.21.1-py3-none-any.whl
- Upload date:
- Size: 71.2 kB
- Tags: Python 3
- Uploaded using Trusted Publishing? No
- Uploaded via: twine/4.0.2 CPython/3.9.15
File hashes
| Algorithm | Hash digest | |
|---|---|---|
| SHA256 |
b029ad99299efa8027dbcc1d645bfdbc70825d433c75d04bf1cb77feea4239db
|
|
| MD5 |
39bddf6ea6cabab9e69e4ddad29d9239
|
|
| BLAKE2b-256 |
4adfd9042023f3c4cdc19abd956b586ca1344ca037ce3a1c7c527384419f4bce
|


