A Python API for Intelligent Data Discovery


Project description

A Python API for Intelligent Visual Discovery


Lux is a Python library that makes data science easier by automating aspects of the data exploration process. Lux facilitate faster experimentation with data, even when the user does not have a clear idea of what they are looking for. Visualizations are displayed via an interactive Jupyter widget to allow users to quickly browse through large collections of data directly within their Jupyter notebooks.
Here are some slides from a recent talk on Lux.
Try out Lux on your own in a live Jupyter Notebook here!
Getting Started
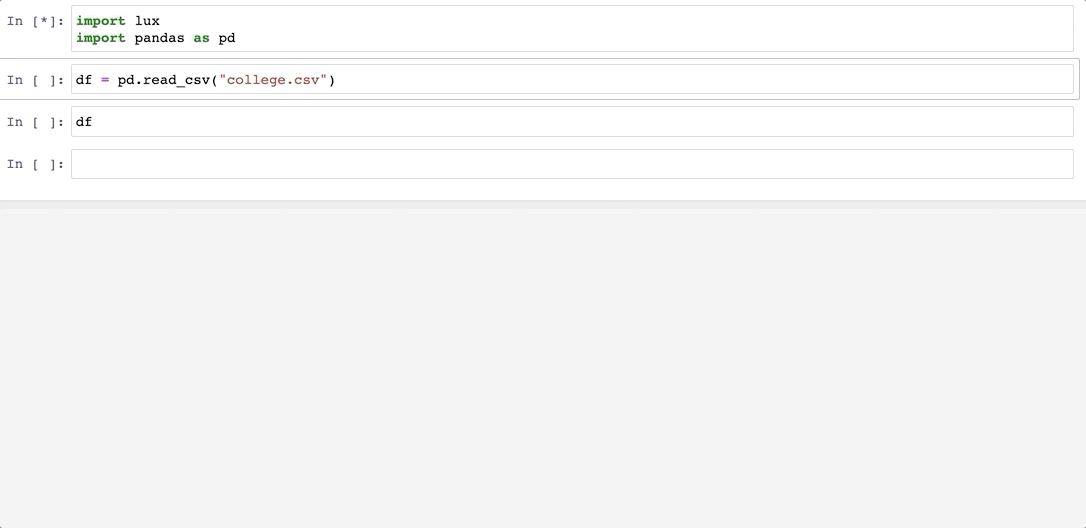
To start using Lux, simply add an extra import statement along with your Pandas import.
import lux
import pandas as pd
Then, Lux can be used as-is, without modifying any of your existing Pandas code. Here, we use Pandas's read_csv command to load in a dataset of colleges and their properties.
    df = pd.read_csv("college.csv")
    df
Voila! Here's a set of visualizations that you can now use to explore your dataset further!
Next-step recommendations based on user intent:
In addition to dataframe visualizations at every step in the exploration, you can specify in Lux the attributes and values you're interested in. Based on this intent, Lux guides users towards potential next-steps in their exploration.
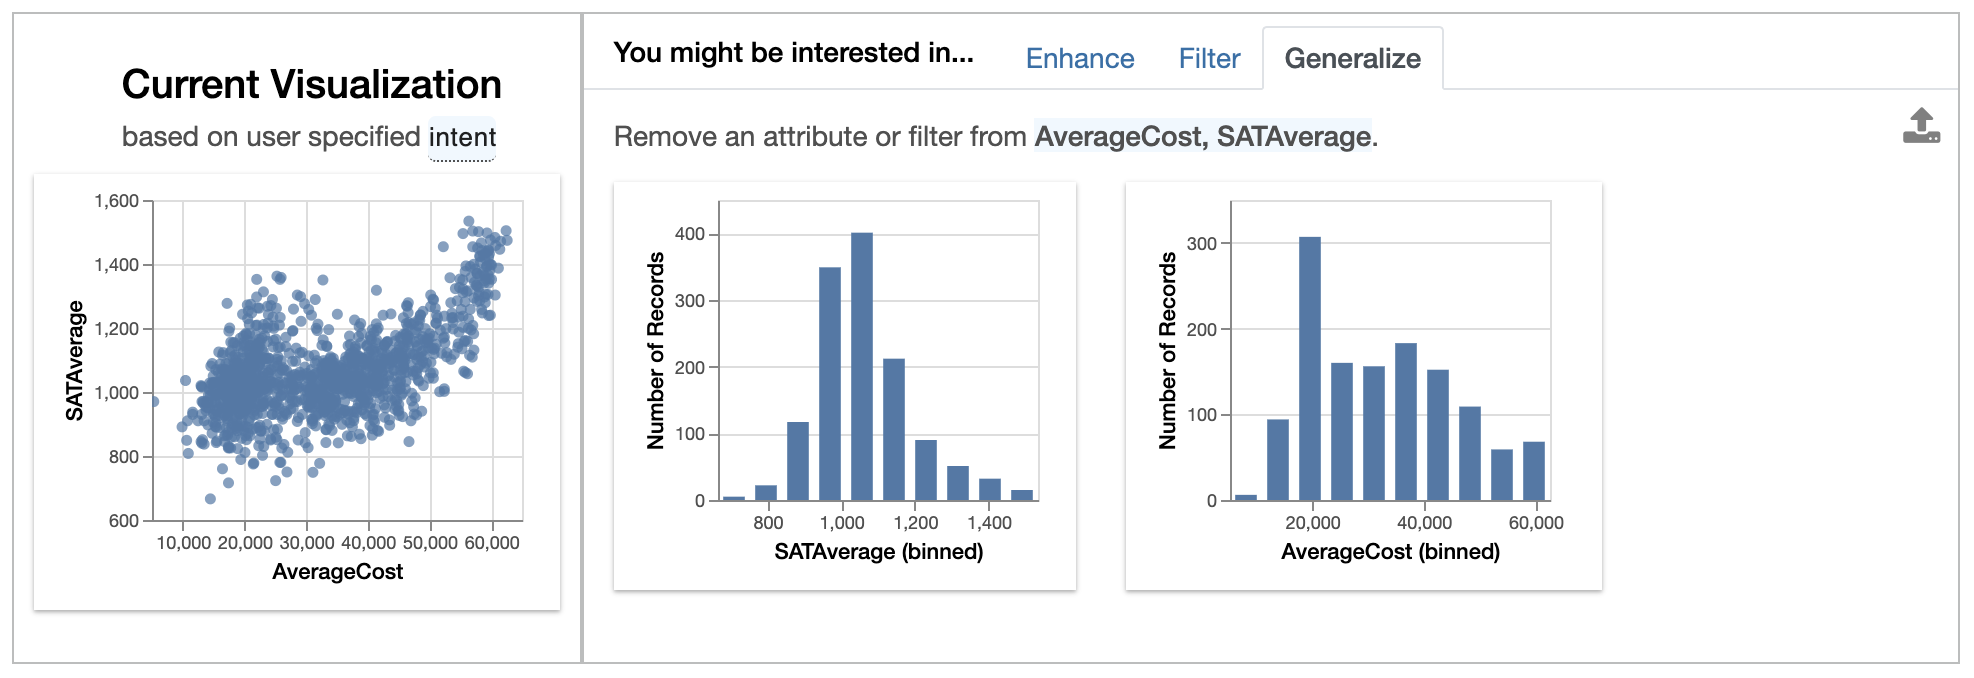
For example, we might be interested in the attributes AverageCost and SATAverage.
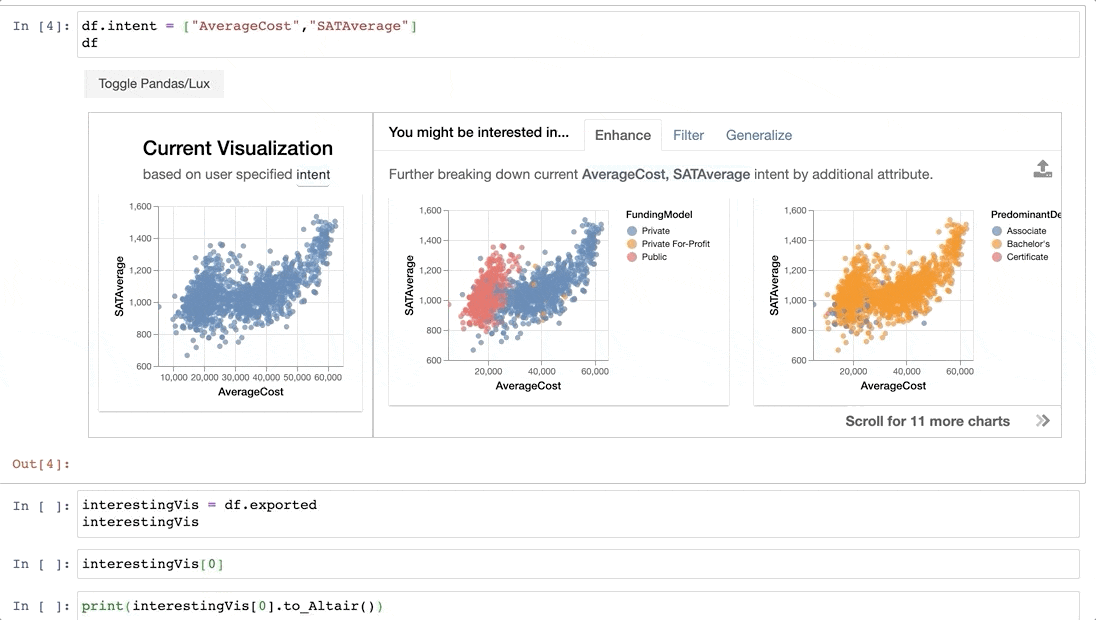
    df.intent = ["AverageCost","SATAverage"]
    df
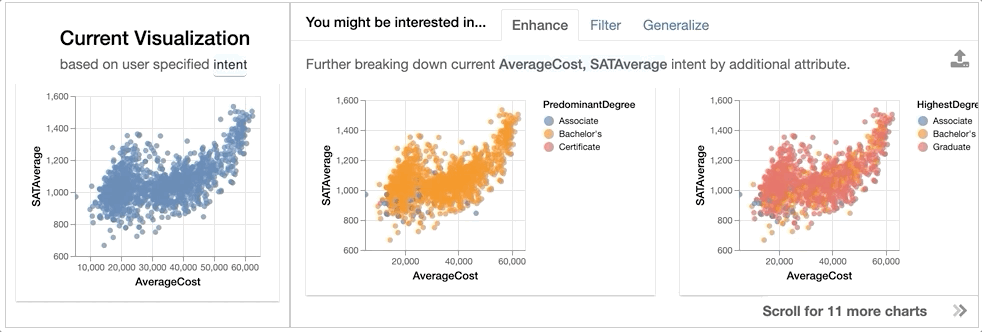
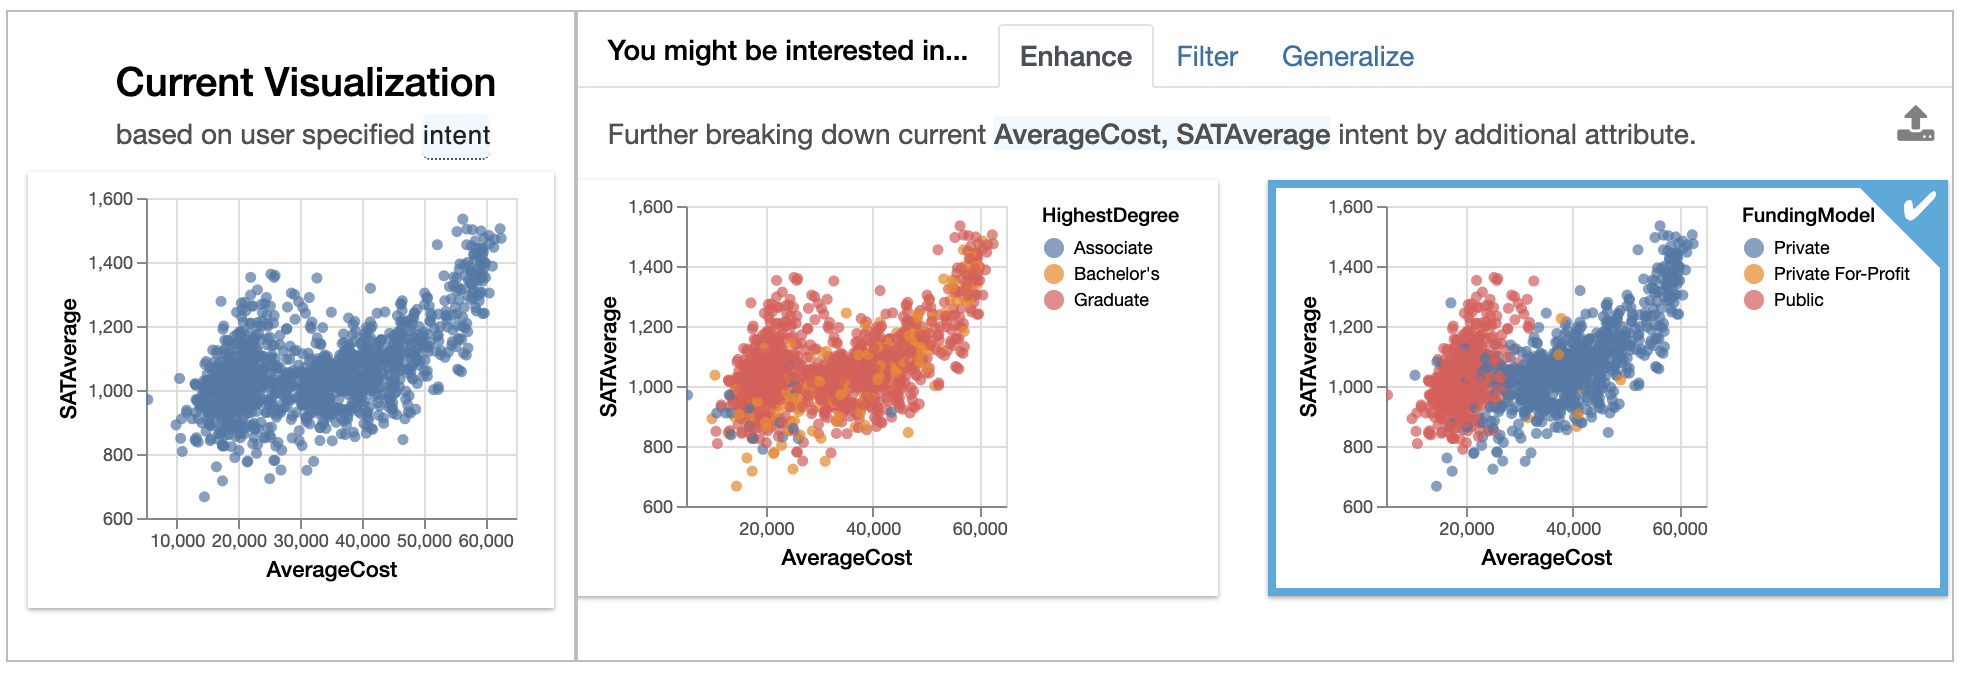
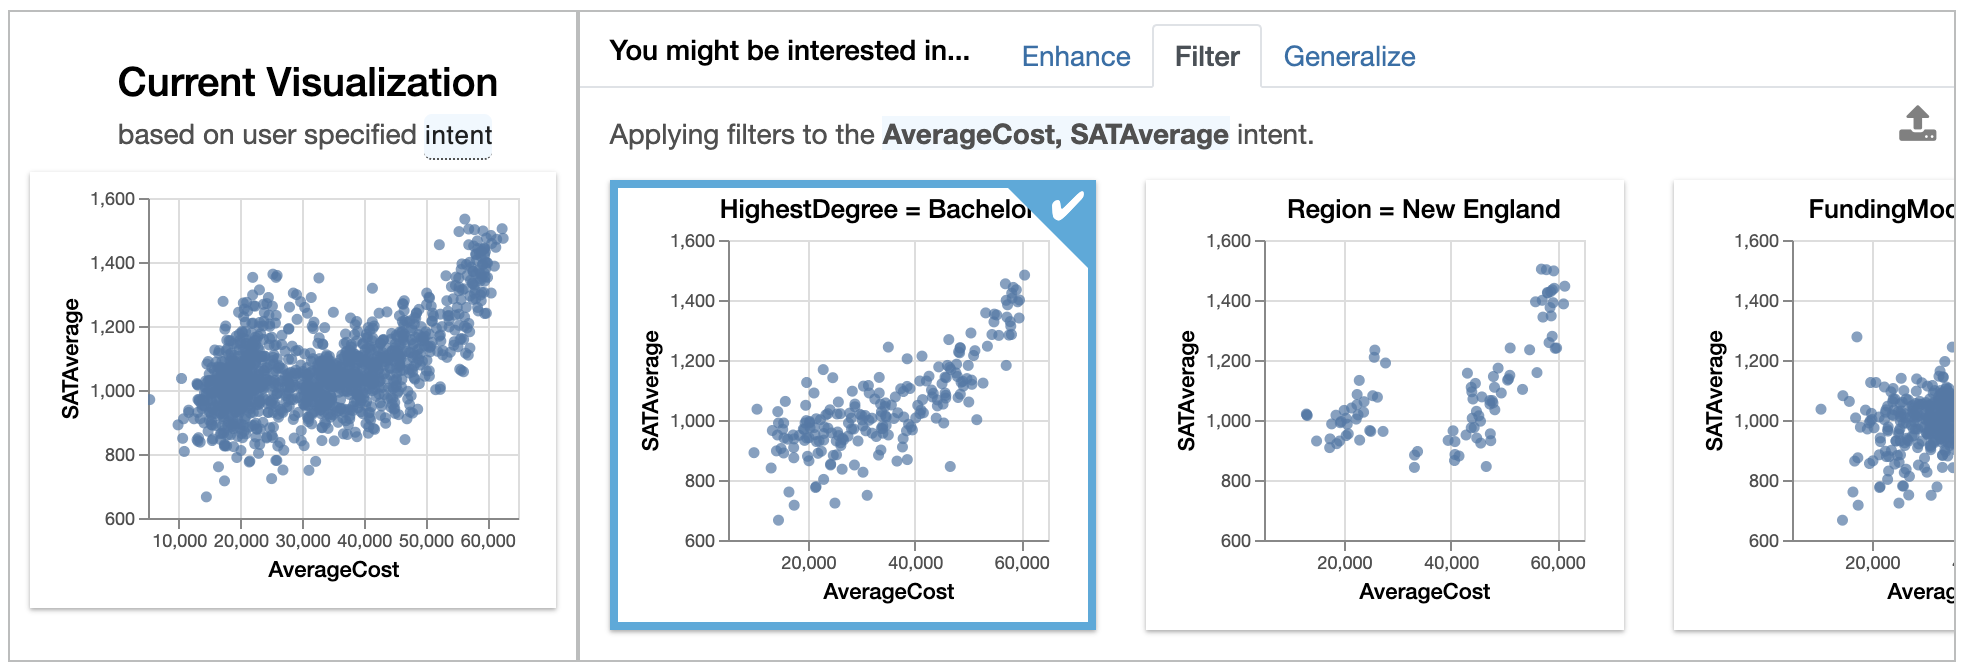
The left-hand side of the widget shows the current visualization, i.e., the current visualization generated based on what the user is interested in. On the right, Lux generates three sets of recommendations, organized as separate tabs on the widget:
Enhanceadds an additional attribute to the current selection, essentially highlighting how additional variables affect the relationship ofAverageCostandSATAverage. We see that if we breakdown the relationship byFundingModel, there is a clear separation between public colleges (shown in red) and private colleges (in blue), with public colleges being cheaper to attend and with SAT average of lower than 1400.Filteradds a filter to the current selection, while keeping attributes (on the X and Y axes) fixed. These visualizations show how the relationship ofAverageCostandSATAveragechanges for different subsets of data. For instance, we see that colleges that offer Bachelor's degree as its highest degree show a roughly linear trend between the two variables.Generalizeremoves an attribute to display a more general trend, showing the distributions ofAverageCostandSATAverageon its own. From theAverageCosthistogram, we see that many colleges with average cost of around $20000 per year, corresponding to the bulge we see in the scatterplot view.
See this page for more information on additional ways for specifying the intent.
Easy programmatic access of exported visualization objects:
Now that we have found some interesting visualizations through Lux, we might be interested in digging into these visualizations a bit more. We can click on one or more visualizations to be exported, so we can programmatically access these visualizations further in Jupyter. Visualizations are represented as Vis objects in Lux. These Vis objects can be translated into Altair or VegaLite code, so that we can further edit these visualizations.
Quick, on-demand visualizations with the help of automatic encoding:
We've seen how Viss are automatically generated as part of the recommendations. Users can also create their own Vis via the same syntax as specifying the intent. Lux is built on the philosophy that users should always be able to visualize anything they want, without having to think about how the visualization should look like. Lux automatically determines the mark and channel mappings based on a set of best practices from Tableau. The visualizations are rendered via Altair into Vega-Lite specifications.
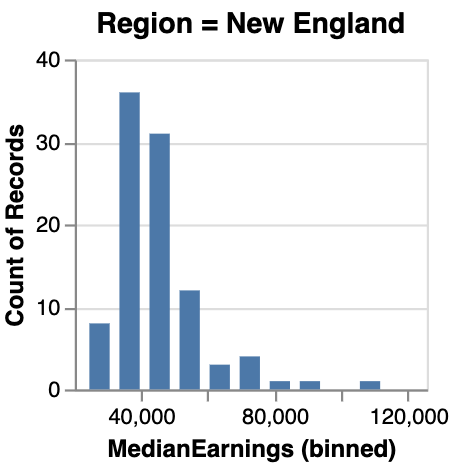
    from lux.vis.Vis import Vis
    newEnglandCost = Vis(["Region=New England","MedianEarnings"],df)
    newEnglandCost
Powerful language for working with collections of visualizations:
Lux provides a powerful abstraction for working with collections of visualizations based on a partially specified queries. Users can provide a list or a wildcard to iterate over combinations of filter or attribute values and quickly browse through large numbers of visualizations. The partial specification is inspired by existing work on intent languages for visualization languages, including ZQL and CompassQL.
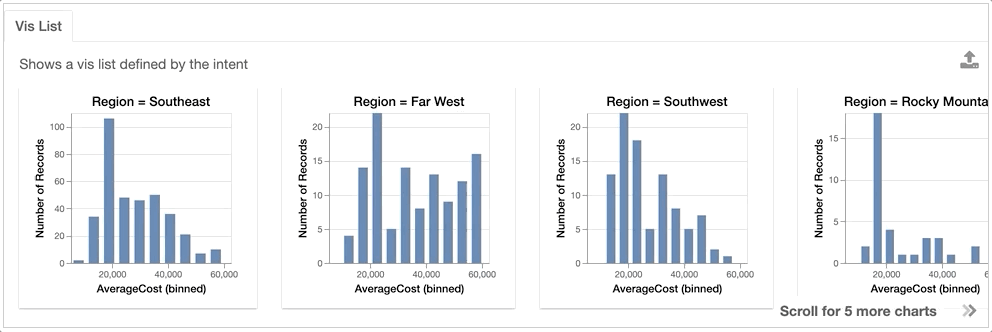
For example, we might be interested in looking at how the AverageCost distribution differs across different Regions.
    from lux.vis.VisList import VisList
    differentRegions = VisList(["Region=?","AverageCost"],df)
    differentRegions
To find out more about other features in Lux, see the complete documentation on ReadTheDocs.
Quick Installation
To get started, Lux can be installed through PyPI. This installs both the lux-api (this repo) and lux-widget (the Lux Jupyter widget frontend).
pip install lux-api
To install and activate the Jupyter notebook extension:
    jupyter nbextension install --py luxwidget
    jupyter nbextension enable --py luxwidget
Dev Installation
To set up Lux manually for development purposes, you should clone the two Github repos for Lux: 1) the core Python Lux API and 2) the Jupyter widget frontend.
To install the Python Lux API:
    git clone https://github.com/lux-org/lux.git
    cd lux/
    python setup.py install
To install the Lux Jupyter Widget:
    pip install git+https://github.com/lux-org/lux-widget
    jupyter nbextension install --sys-prefix --symlink --overwrite --py luxwidget
    jupyter nbextension enable --sys-prefix --py luxwidget
Support and Resources
Lux is undergoing active development. If you are interested in using Lux, we would love to hear from you. Any feedback, suggestions, and contributions for improving Lux are welcome.
Other additional resources:
- Visit ReadTheDoc for more detailed documentation.
- Check out this notebook tutorial series on how to use Lux.
- Join the Lux Slack channel for support and discussion.
- Report any bugs, issues, or requests through Github Issues.
Release history Release notifications | RSS feed


Download files
Download the file for your platform. If you're not sure which to choose, learn more about installing packages.
Source Distribution
Built Distribution
Filter files by name, interpreter, ABI, and platform.
If you're not sure about the file name format, learn more about wheel file names.
Copy a direct link to the current filters
File details
Details for the file lux-api-0.2.0.tar.gz.
File metadata
- Download URL: lux-api-0.2.0.tar.gz
- Upload date:
- Size: 71.0 kB
- Tags: Source
- Uploaded using Trusted Publishing? No
- Uploaded via: twine/3.2.0 pkginfo/1.5.0.1 requests/2.23.0 setuptools/41.6.0 requests-toolbelt/0.9.1 tqdm/4.48.2 CPython/3.7.7
File hashes
| Algorithm | Hash digest | |
|---|---|---|
| SHA256 |
1569348c27b72561bc386b8ea93f07348d8872e0ddcee469a73dc0d539565658
|
|
| MD5 |
2c274b0b600109ffa2410ee2a864de33
|
|
| BLAKE2b-256 |
5c24939d8d03220d5ef9d5d772fd91c9ed7b0c7f92eb71e599affbe6a04921e9
|
File details
Details for the file lux_api-0.2.0-py2.py3-none-any.whl.
File metadata
- Download URL: lux_api-0.2.0-py2.py3-none-any.whl
- Upload date:
- Size: 109.4 kB
- Tags: Python 2, Python 3
- Uploaded using Trusted Publishing? No
- Uploaded via: twine/3.2.0 pkginfo/1.5.0.1 requests/2.23.0 setuptools/41.6.0 requests-toolbelt/0.9.1 tqdm/4.48.2 CPython/3.7.7
File hashes
| Algorithm | Hash digest | |
|---|---|---|
| SHA256 |
a5278bd48d59ff2f4c7dc3efa6a45eec80b6cacf1a6ba53f57188edff65af238
|
|
| MD5 |
0fe4fad88155c0567ae385e1b0226f04
|
|
| BLAKE2b-256 |
8846342e5126f7508c005521c963e55fcdec42f323991e8d2b7d9a49bf14f35b
|


