Format numbers as multiples of Pi

Project description
Matplotlib Format Pi
DOCS
Branches
Master
| Version | Upload Status | Downloads |
|---|---|---|
 |
 |
 |
Release
| Version | Upload Status | Size |
|---|---|---|
 |
 |
 |
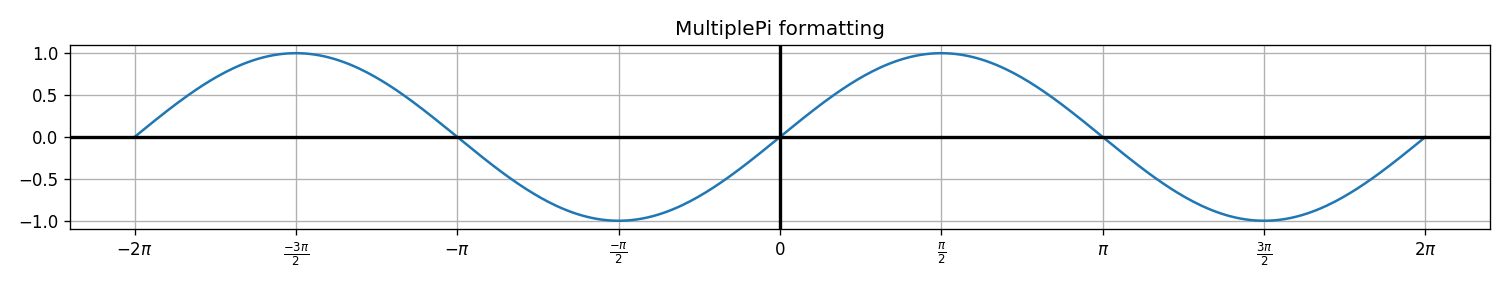
Format multiples of pi as strings on Matplotlib axes.
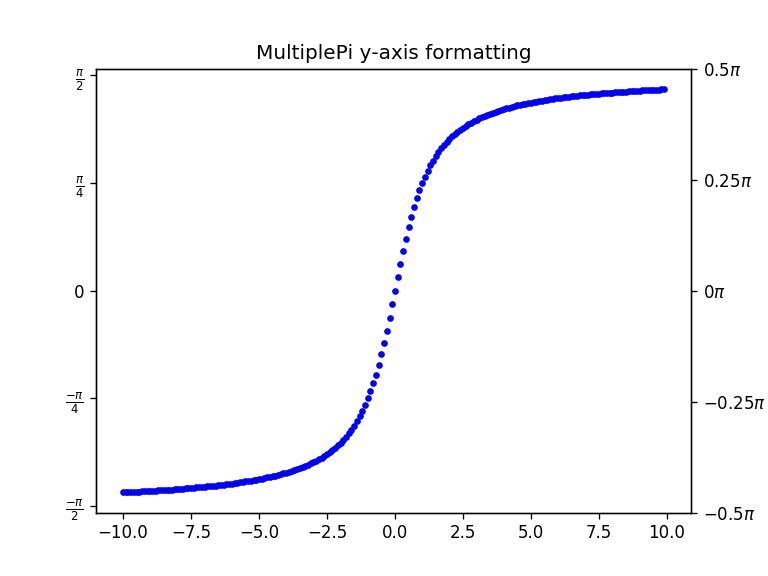
The MultiplePi class creates a Locator to place ticks at desired multiples and a Formatter to format all tick labels.
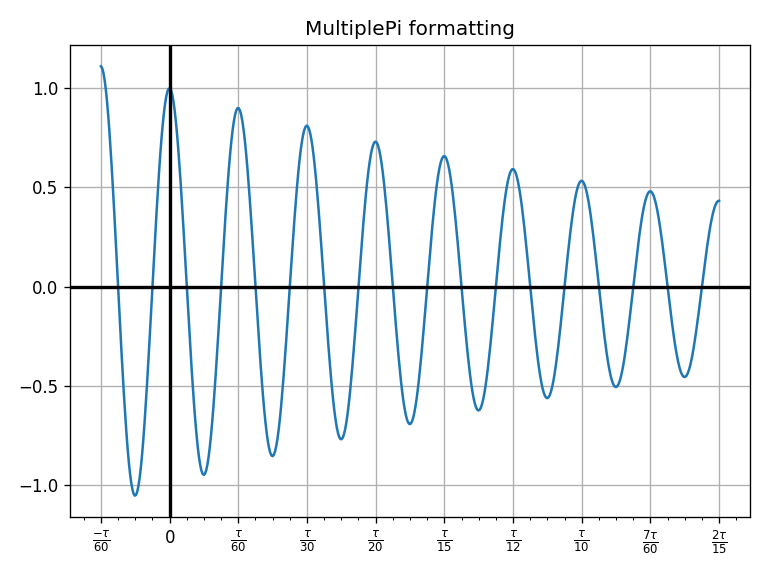
The base (π or τ) can be divided by any Natural Number.
Multiples of one-π or one-τ can be placed/formatted too. (2π, 3π, 2τ, 3τ, etc.)
Installing
pip install matplot-fmt-pi
Examples
from matplot_fmt_pi.ticker import MultiplePi
Simply, the instance can be asssigned a denominator of pi then passed to matplotlib.
The parameters can also be modified to adjust the output to something more sophisticated.
Running Examples
Clone, then from the repo,
cd examples/
python *.py
Put the repo's directory in the python path to import the matplot_fmt_pi folder not the installed package.
PYTHONPATH=/home/user/py-pros/format-pi python examples/pi_graph.py
Todo
- Add testing option once installed (Like
numpy.test()) - Windows
make.bat?
Meta

Inspired by this post on StackOverflow.
Release history Release notifications | RSS feed


Download files
Download the file for your platform. If you're not sure which to choose, learn more about installing packages.
Source Distribution
Built Distribution
Filter files by name, interpreter, ABI, and platform.
If you're not sure about the file name format, learn more about wheel file names.
Copy a direct link to the current filters
File details
Details for the file matplot-fmt-pi-2.1.0.tar.gz.
File metadata
- Download URL: matplot-fmt-pi-2.1.0.tar.gz
- Upload date:
- Size: 6.6 kB
- Tags: Source
- Uploaded using Trusted Publishing? No
- Uploaded via: twine/4.0.2 CPython/3.8.16
File hashes
| Algorithm | Hash digest | |
|---|---|---|
| SHA256 |
c0d598209c0581e5e9e38051134516c3f59c744a7e4efce26dbd9f108bd2f6cf
|
|
| MD5 |
6f6c42c6973a63ba62c62d18ba3ac62a
|
|
| BLAKE2b-256 |
cd55c607ba84a34470d23bf64fe12625b87864a54b35f7ff82ce9224e6275bac
|
File details
Details for the file matplot_fmt_pi-2.1.0-py3-none-any.whl.
File metadata
- Download URL: matplot_fmt_pi-2.1.0-py3-none-any.whl
- Upload date:
- Size: 6.8 kB
- Tags: Python 3
- Uploaded using Trusted Publishing? No
- Uploaded via: twine/4.0.2 CPython/3.8.16
File hashes
| Algorithm | Hash digest | |
|---|---|---|
| SHA256 |
efb36d32db015f37f57e1aaa7fa9ef0c2ca1884441c1d34ce50042c0498b62fa
|
|
| MD5 |
9622a149189e9b9d8f632dac6eae3124
|
|
| BLAKE2b-256 |
879ea6355c947711e279d9c098e5a3b40d34cae23ae44016fd9a85696dfe22df
|


