Tufte-style plots for matplotlib

Project description
matplotlib-tufte
matplotlib-tufte is a python module to create Tufte-like plots with matplotlib.
Inspiration is drawn from Edward Tufte: The Visual Display of Quantitative Information.
Requirements
- python >= 3.7
- matplotlib
Examples
See examples/Basic.ipynb for some small examples of tuftelike plots.
Usage
Create your plots with matplotlib as usual.
Then, run tuftelike.adjust with the x- and y-values of your plot to adjust it in-place.
import matplotlib.pyplot as plt
import tuftelike
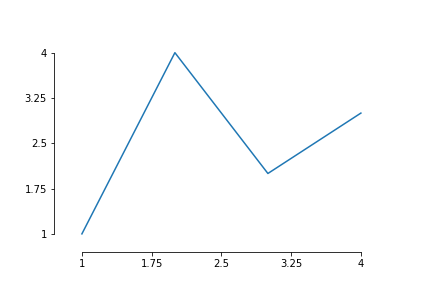
xs, ys = [1, 2, 3, 4], [1, 4, 2, 3]
plt.plot(xs, ys)
tuftelike.adjust(xs, ys)
plt.savefig("example.png")
Tuftelike needs the x- and y-values because matplotlib does not store these internally. The above code produces:
Release history Release notifications | RSS feed


Download files
Download the file for your platform. If you're not sure which to choose, learn more about installing packages.
Source Distribution
Built Distribution
Filter files by name, interpreter, ABI, and platform.
If you're not sure about the file name format, learn more about wheel file names.
Copy a direct link to the current filters
File details
Details for the file matplotlib_tufte-1.1.1.tar.gz.
File metadata
- Download URL: matplotlib_tufte-1.1.1.tar.gz
- Upload date:
- Size: 8.4 kB
- Tags: Source
- Uploaded using Trusted Publishing? No
- Uploaded via: poetry/1.5.1 CPython/3.7.17 Linux/5.4.109+
File hashes
| Algorithm | Hash digest | |
|---|---|---|
| SHA256 |
736277d14a3c3845eecca3737f884d99e752bef605325839275fd55aeacdb008
|
|
| MD5 |
d35f92e9d5cae998d8565d95308ab145
|
|
| BLAKE2b-256 |
67824f3e3192da688c86b540aef89fcee3d434d300f90b4d70d9e3e7ab3c7a2e
|
File details
Details for the file matplotlib_tufte-1.1.1-py3-none-any.whl.
File metadata
- Download URL: matplotlib_tufte-1.1.1-py3-none-any.whl
- Upload date:
- Size: 17.3 kB
- Tags: Python 3
- Uploaded using Trusted Publishing? No
- Uploaded via: poetry/1.5.1 CPython/3.7.17 Linux/5.4.109+
File hashes
| Algorithm | Hash digest | |
|---|---|---|
| SHA256 |
5e16a9aae52659ebd72d7505285a67feca0f8e321e07184787f95dc86f1e63d6
|
|
| MD5 |
c5257ef4d37ccf47661271685309c346
|
|
| BLAKE2b-256 |
4b7c9eeb92d81ef963eb354a75f03bb31228f5fe5d990bda946f62ebcaec790b
|


