MATSim Agent-Based Transportation Simulation Framework - official python tools


Project description
matsim-tools
Official tools for working with MATSim output files
MATSim is an open-source, multi-agent transportation simulation framework. Find out more about MATSim at https://matsim.org
About this library
We are at the very early stages of building this library. The API will change, things will break, and there are certainly bugs. You probably shouldn't use this for anything.
- Our primary goal is to make MATSim play nice with pandas and geopandas, for data analysis workflows.
- We have only tested this using Anaconda Python. Only Python 3.x is supported.
- Currently MATSim network, event, and plans files are supported. Hopefully more will be coming soon.
- For Geopandas network support, you also need to install
geopandasandshapely. - Supports JSON and Protobuf event file formats
- Can write MATSim files too!
Quickstart
-
Install using
pip install matsim-tools -
In lieu of real documentation, here is some sample code to get you started. Good luck!
Read a network
This reads a MATSim network file in .xml.gz format, and creates an object with two
dataframes: one for nodes, and one for links.
import matsim
import pandas as pd
from collections import defaultdict
%matplotlib inline
# -------------------------------------------------------------------
# 1. NETWORK: Read a MATSim network:
net = matsim.read_network('output_network.xml.gz')
net.nodes
# Dataframe output:
# x y node_id
# 0 -20000.0 0.0 1
# 1 -15000.0 0.0 2
# 2 -865.0 5925.0 3
# ...
net.links
# Dataframe output:
# length capacity freespeed ... link_id from_node to_node
# 0 10000.0 36000.0 27.78 ... 1 1 2
# 1 10000.0 3600.0 27.78 ... 2 2 3
# 2 10000.0 3600.0 27.78 ... 3 2 4
# ...
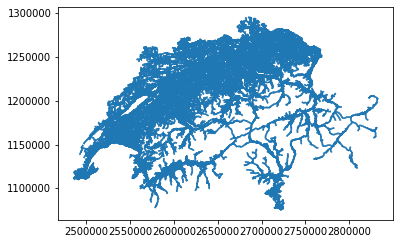
# Extra: create a Geopandas dataframe with LINESTRINGS for our network
geo = net.as_geo()
geo.plot() # try this in a notebook to see your network!
Event processing
MATSim event files do not convert easily to Pandas dataframes, because every event type has a different set of properties, while dataframes expect a well-defined set of columns.
Depending on your use case, your options are to either (1) filter specific event types into separate dataframes (one for each type), or (2) collect the data you need into python dictionaries and/or lists which can be converted to dataframes at the end (or just analyzed using regular Python).
Be warned that the event ORDER in MATSim event files is important, so separating event types into separate dataframes is often a bad idea. Option (2) above is a bit more work but very likely what you need to do.
The following code snippets show some examples of each.
# -------------------------------------------------------------------
# 2. EVENTS: Stream through a MATSim event file.
# The event_reader returns a python generator function, which you can then
# loop over without loading the entire events file in memory.
#
# ---------
# Example 1: Sum up all 'entered link' events to get link volumes.
# Supports both .xml.gz and protobuf .pb.gz event file formats!
# Only returns events of type 'entered link' and 'left link':
from collections import defaultdict
events = matsim.event_reader('output_events.xml.gz', types='entered link,left link')
# defaultdict creates a blank dict entry on first reference; similar to {} but more friendly
link_counts = defaultdict(int)
for event in events:
if event['type'] == 'entered link':
link_counts[event['link']] += 1
# convert our link_counts dict to a pandas dataframe,
# with 'link_id' column as the index and 'count' column with value:
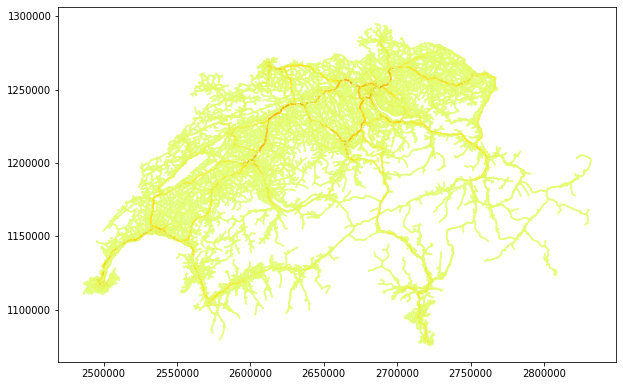
link_counts = pd.DataFrame.from_dict(link_counts, orient='index', columns=['count']).rename_axis('link_id')
# attach counts to our Geopandas network from above
volumes = geo.merge(link_counts, on='link_id')
volumes.plot(column='count', figsize=(10,10), cmap='Wistia') #cmap is colormap
Events example: Convert an event type to a dataframe
# ---------
# Example 2: Convert one event type to a dataframe

# Only return actstart and actend events
events = matsim.event_reader('output_events.xml.gz', types='actstart,actend')

event_lists = { 'actstart': [], 'actend': [] }

for event in events:
    # Use event type as lookup string
    eventType = event['type']
    # Append the entire event to the list of events of this type
    event_lists[eventType].append(event)

# Convert lists to Pandas DataFrames - one for each type
df_actstart = pd.DataFrame(event_lists['actstart'])
df_actend = pd.DataFrame(event_lists['actend'])
Events example: Build lookups for event types I'm interested in
# ---------
# Example 3: Build lookups for event types I'm interested in

import matsim
import pandas as pd
from collections import defaultdict

events_file = "output_events.xml.gz"

print("reading events:", events_file)

# Read events - filter and return the listed event types only
events = matsim.event_reader(
    events_file,
    types="DrtRequest submitted,PassengerRequest scheduled",
)

# Save drt_requests by person_id
drt_requests = defaultdict(list)

# Loop on all filtered events
for event in events:
    if event["type"] == "PassengerRequest scheduled":
        drt_requests[event["person"]].append(event["vehicle"])


# Convert to dataframe
df_requests = pd.DataFrame.from_dict(drt_requests, orient="index").rename_axis('id')
Plan files
Each plan is returned as a tuple with its owning person (for now)
- Use
selectedPlansOnly = Trueto only return selected plans - The name of the element is in its
.tag(e.g. 'plan', 'leg', 'route', 'attributes') - An element's attributes are accessed using
.attrib['attrib-name'] - Use the element's
.textfield to get data outside of attributes (e.g. a route's list of links) - Every element can be iterated on to get its children (e.g. the plan's activities and legs)
- Always emits person, even if that person has no plans
# -------------------------------------------------------------------
# 3. PLANS: Stream through a MATSim plans file.

plans = matsim.plan_reader('output_plans.xml.gz', selected_plans_only = True)

# Each plan is returned as a tuple with its owning person (for now, is this ok?)
# - The name of the element is in its .tag (e.g. 'plan', 'leg', 'route', 'attributes')
# - An element's attributes are accessed using .attrib['attrib-name']
# - Use the element's .text field to get data outside of attributes (e.g. a route's list of links)
# - Every element can be iterated on to get its children (e.g. the plan's activities and legs)
# - Emits person even if that person has no plans

for person, plan in plans:

    # do stuff with this plan, e.g.
    work_activities = filter(
        lambda e: e.tag == 'activity' and e.attrib['type'] == 'w',
        plan)

    print('person', person.attrib['id'], 'selected plan w/', len(list(work_activities)), 'work-act')
    activities.append(num_activities)

# person 1 selected plan w/ 2 work-act
# person 10 selected plan w/ 1 work-act
# person 100 selected plan w/ 1 work-act
# ...
Write MATSim input XML files
# -------------------------------------------------------------------
# 4. WRITERS: Write MATSim input files.

# MATSim input files may be iteratively constructed as in the example below.
# For a more detailed example, see tests/test_MatsimPlansWriter.py

with open("plans.xml", 'wb+') as f_write:
    writer = matsim.writers.PopulationWriter(f_write)

    writer.start_population()
    writer.start_person("person_id_123")
    writer.start_plan(selected=True)

    writer.add_activity(type='home', x=0.0, y=0.0, end_time=8*3600)
    writer.add_leg(mode='walk')
    writer.add_activity(type='work', x=10.0, y=0.0, end_time=18*3600)
    writer.add_leg(mode='pt')
    writer.add_activity(type='home', x=0.0, y=0.0)

    writer.end_plan()
    writer.end_person()

    writer.end_population()
Calibration
Scenarios created with the matsim-application contrib provide an interface that can be used with the automatic calibration module:
# -------------------------------------------------------------------
# 5. CALIBRATION: Automatic calibration for MATSim scenario.

from matsim.calibration import create_calibration, ASCCalibrator, utils, study_as_df

modes = ["walk", "car", "pt", "bike"]
fixed_mode = "walk"
target = {
    "walk": 0.277,
    "bike": 0.175,
    "pt": 0.19,
    "car": 0.359
}

def filter_persons(df):
    return df[df.subpopulation == "person"]

def filter_modes(df):
    return df[df.main_mode.isin(modes)]

study, obj = create_calibration("calib", ASCCalibrator(modes, initial, target, fixed_mode=fixed_mode,
                                                       lr=utils.linear_scheduler(start=0.25, interval=10)),
                                "./matsim-scenario-1.0-SNAPSHOT.jar",
                                "./scenarios/input/scenario-v1.0-10pct.config.xml",
                                args="--config:controler.lastIteration 400",
                                jvm_args="-Xmx12G -Xmx12G -XX:+AlwaysPreTouch -XX:+UseParallelGC",
                                transform_persons=filter_persons,
                                transform_trips=filter_modes,
                                chain_runs=utils.default_chain_scheduler, debug=False)

study.optimize(obj, 10)

df = study_as_df(study)
df.to_csv("report.csv")

from matsim.calibration.plot import plot_study

plot_study(study)
Release history Release notifications | RSS feed


Download files
Download the file for your platform. If you're not sure which to choose, learn more about installing packages.
Source Distribution
Built Distribution
Filter files by name, interpreter, ABI, and platform.
If you're not sure about the file name format, learn more about wheel file names.
Copy a direct link to the current filters
File details
Details for the file matsim_tools-0.0.22.tar.gz.
File metadata
- Download URL: matsim_tools-0.0.22.tar.gz
- Upload date:
- Size: 169.0 kB
- Tags: Source
- Uploaded using Trusted Publishing? No
- Uploaded via: twine/6.2.0 CPython/3.10.10
File hashes
| Algorithm | Hash digest | |
|---|---|---|
| SHA256 |
81f88d7f9bd5683b99e94edd62cc2a0682dd053e5c22bbebb462c2d5513341b2
|
|
| MD5 |
5f2781de0521949c7647117c8073a02c
|
|
| BLAKE2b-256 |
80094d06ef24254fd00adabe39d97025ba9efe286e8287a6cb4c00965c085a69
|
File details
Details for the file matsim_tools-0.0.22-py3-none-any.whl.
File metadata
- Download URL: matsim_tools-0.0.22-py3-none-any.whl
- Upload date:
- Size: 195.4 kB
- Tags: Python 3
- Uploaded using Trusted Publishing? No
- Uploaded via: twine/6.2.0 CPython/3.10.10
File hashes
| Algorithm | Hash digest | |
|---|---|---|
| SHA256 |
f13c4eafe464919d4e350d352fb952db06dd5b07e3199f4a227b1cd4627913f7
|
|
| MD5 |
110ba866c9e1e397b52494baa185c836
|
|
| BLAKE2b-256 |
673c87fbe34ef0a79ea7fd02adbc997e3461b5d66ddd1797fd9828f558d1f285
|


