Mermaidian is a simple Python interface for using Mermaid.js diagramming capabilities from Python. It can be used from stand-alone Python and also from IPython based notebooks. The core Mermaid.js syntax for writing diagram code is preserved so that the user can always refer to Mermaid.js documentation. However, the creation of the frontmatter for configuration and custom theme is made easier by using a dict instead of YAML encoding.

Project description
Mermaidian


Mermaidian is a simple Python interface for using Mermaid.js diagramming capabilities from Python. It can be used from stand-alone Python or also from IPython based (Jupyter) notebooks. The core Mermaid.js syntax for writing diagram code is preserved so that the user can always refer to Mermaid.js documentation. However, the creation of the frontmatter for configuration and custom theme is made easier by using a dict instead of YAML encoding.
A sample Mermaid.js diagram generated using mermaidian is given below:
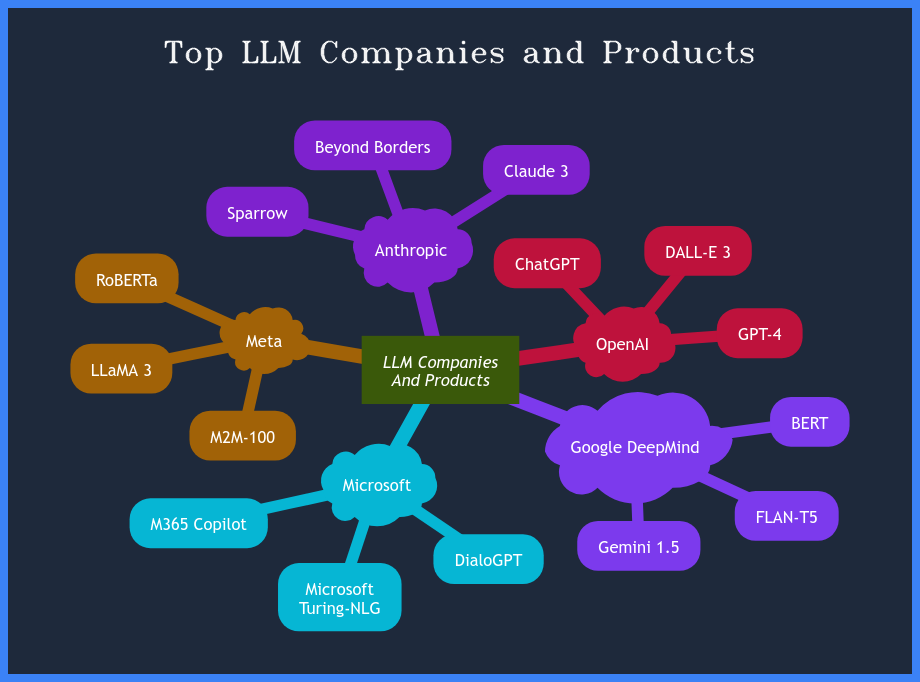
Table of Contents 📋
- Introduction
- Technologies Used
- Getting Started
- Mermaidian Main Functions
- Examples
- Conclusions
- License
- References
Introduction
Mermaid.js is a Javascript based tool for creating diagrams and charts from a set of Markdown-like text-lines. Each type of diagram has specific syntax which is clearly document on Mermaid.js homepage.
The way to use Mermaid.js from Python is through the mermaid.ink service, which returns diagrams as response to http requests in prescribed formats (see https://mermaid.ink/ for details).
Mermaidian is a Python package that uses mermaid.ink service to enable using Mermaid.js from Python environments. It provides a set of functions for getting, displaying and saving Mermaid.js diagrams.
Mermaid.js is a great package for creating various types of drawings and charts. However, it does not provide proper control for adding paddings, borders and titles. Mermaidian enhances these capabilities by providing simple functions to add custom paddings, border and title to the diagrams returned from mermaid.ink. For IPython users, it also provides functions for centralizing displaying of the diagrams.
The following functions are meant to be used from the calling program (other functions are internal):
- get_mermaid_diagram(): The main function to get the desired diagram either as image binary (bytes) or SVG text
- add_paddings_border_and_title_to_image(): To add paddings, border and title to the diagram in png or jpg format
- add_paddings_border_and_title_to_svg(): To add paddings, border and title to the diagram in svg format
- show_image_ipython(): For displaying diagram from an image object in IPython setting (e.g. Jupyter notebook)
- show_svg_ipython_centered(): Show an svg diagram "centralized" only in IPython/Jupyter setting
- show_image_ipython_centered(): Show an image diagram "centralized" only in IPython/Jupyter setting
- show_image_pyplot(): For displaying diagram from an image object with matplotlib's pyplot
- show_image_cv2(): For displaying diagram from an image object using cv2.imshow().Doesn't work in some notebooks
- show_svg_ipython(): For displaying diagram from a SVG object in IPython setting (e.g. Jupyter notebook)
- save_diagram_as_image(): For saving the diagram as an image (png, jpeg etc.)
- save_diagram_as_svg(): For saving the diagram as a SVG file
The mermaidian functions allow you to specify various options as key-value pairs. For the details of available mermaid.ink options, see https://mermaid.ink/ and for mermaid configuration options, see https://mermaid.js.org/config/schema-docs/config.html
For a detailed help description on mermaidian, execute help(mm) after importing it as mm
Technologies-Used


Getting-Started
- Install mermaidian using
pip install mermaidian - Read the "mermaidian Functions" section for knowing purpose and syntax of callable functions
- See the examples to understand how mermaidian works.
Mermaidian Main Functions
The Mermaidian package has following functions for getting, showing and saving Mermaid.js diagrams.
get_mermaid_diagram(format, diagram_code, theme="forest",config={},options={}, title='')
Sends a 'get' request to "https://mermaid.ink/" to get a diagram. The request includes a string of frontmatter, diagram-string, and options.
Parameters:
- format (str): The format of the requested diagram. One of 'svg', 'pdf', 'png','jpeg' or 'webp'.
- title (str): Title of the diagram. Empty string for no title.
- diagram_code: The actual Mermaid code for the diagram as per Mermaid.js documentation
- theme (str/dict): The theme of the Mermaid diagram. Can be a string or a dict. If string, then it can take one of 'forest', 'dark', 'neutral', 'default' or 'base' values. If dict, then it can have option-value pairs for theme_variables (see https://mermaid.js.org/config/schema-docs/config.html)
- config (dict): A dictionary for all Mermaid.js configuration options except 'theme' and 'theme_variables'. See https://mermaid.js.org/config/schema-docs/config.html
- options (dict): a dict of option-value pairs. Some valid options include "bgColor", "width", "scale" etc.
Returns: The diagram content in the requested form
add_paddings_border_and_title_to_image(image_bytes, padding_data={}, title_data={})
Adds paddings, border and title to the diagram in png or jpg format
Parameters:
-
padding_data (dict): A dict with required padding and border properties
- padding_data_defaults = {'pad_x':40, 'pad_top':40, 'pad_bottom':40, 'pad_color':'#aaaaaa', 'border_color':'#000000', 'border_thickness':2}
where, pad_x is for left and right paddings and pad_top and pad_bottom are for top and bottom paddings respectively.
- padding_data_defaults = {'pad_x':40, 'pad_top':40, 'pad_bottom':40, 'pad_color':'#aaaaaa', 'border_color':'#000000', 'border_thickness':2}
-
title_data (dict): A dict with required title properties The following describes the items in the title_data with default values.
- title_data_defaults = {'title':'', 'position':'tc', 'title_margin_x':20, 'title_margin_y':20, 'font_name':'simplex', 'font_scale':0.6, 'font_color':'#000000', 'font_bg_color':'', 'font_thickness':1}
'position' is the title's position and can be any one of the following seven positions: 'tl' (top-left), 'tc' (top-center), 'tr' (top-right), 'mc' (middle-center), 'bl' (bottom-left), 'bc' (bottom-center), and 'br' (bottom-right)
'font_name' can be any cv2 font name including: 'simplex', 'plain', 'duplex', 'complex', 'triplex', 'complex_small', 'script_simplex', and 'script_complex'
'font_scale' is a decimal vaue corresponding to font size and 'font_thickness' is an interger (usually 1 or 2) for font weight.
add_paddings_border_and_title_to_svg(svg_str, padding_data={}, title_data_svg={})
Adds paddings, border and title to the diagram in png or jpg format
Parameters:
-
padding_data (dict): A dict with required padding and border properties
- padding_data_defaults = {'pad_x':40, 'pad_top':40, 'pad_bottom':40, 'pad_color':'#aaaaaa', 'border_color':'#000000', 'border_thickness':2}
where, pad_x is for left and right paddings and pad_top and pad_bottom are for top and bottom paddings respectively.
- padding_data_defaults = {'pad_x':40, 'pad_top':40, 'pad_bottom':40, 'pad_color':'#aaaaaa', 'border_color':'#000000', 'border_thickness':2}
-
title_data_svg_defaults = {'title':'', 'position':'tc', 'title_margin_x':20, 'title_margin_y':20, 'font_name':'Arial, sans-serif', 'font_size':16, 'font_color':'#000000', 'font_bg_color':'', 'font_weight':'normal'}
'position' is the title's position and can be any one of the following seven positions: 'tl' (top-left), 'tc' (top-center), 'tr' (top-right), 'mc' (middle-center), 'bl' (bottom-left), 'bc' (bottom-center), and 'br' (bottom-right)
'font_name' is any of usual system's font names (e.g. 'Arial, sans-serif' )
'font_size' is a usual font size (e.g. 16, 20, 32 etc.) and 'font_weight' is usual font weight (e.g. 'normal', 'bold' etc.)
show_image_pyplot(image)
Displays the image-content as an image using matplotlib's pyplot. Works across both IPython and non-IPython.
Parameter: image (bytes): The diagram image to be displayed
Returns: None
show_image_cv2(image)
Displays diagram from an image object using cv2.imshow(). Doesn't work in some notebooks.
Parameter: image (bytes): The diagram image to be displayed
Returns: None
show_image_ipython(image)
Displays the image-content as an image in IPython systems (e.g. Jupyter notebooks). Does not work in non-IPython cases. For non-IPython cases use the show_image_pyplot() function
Parameter: image (bytes): The diagram image to be displayed
Returns: None
show_image_ipython_centered(image_bytes, margin_top, margin_bottom)
Show an image diagram "centralized" (only in IPython/Jupyter setting )
show_svg_ipython(svg)
Displays the SVG-text as an SVG in IPython systems (e.g. Jupyter notebooks). Does not work in non-IPython cases.
Parameter: image (text): The svg text to be displayed
Returns: None
show_svg_ipython_centered(image_bytes, margin_top, margin_bottom)
Show an svg diagram "centralized" (only in IPython/Jupyter setting )
save_diagram_as_image(path, diagram)
Saves the passed diagram content as an image file (png, jpeg, pdf etc.). Works across both IPython and non-IPython. Parameters:
- path (str): Path of the output file.
- diagram (bytes): The diagram to be saved
Returns: None
save_diagram_as_svg(path, diagram)
Saves the passed diagram content as an SVG file. Works across both IPython and non-IPython. Parameters:
- path (str): Path of the output file.
- diagram (SVG text): The SVG of the diagram to be saved
Returns: None
Examples
A number of working examples are given in the "examples" directory of this repository. Some of these examples with outputs are given below.
Common Code
out_path = 'output'

# Following are base values for config, options, pad_data, title_data and title_data_svg for the examples to follow
bg_color = "#ffffff"
config0 = {'fontSize':'24px'}
options0 = {'bgColor': bg_color, 'width': '500'}  # the hex bgColor in option should be witout '#'
pad_data0 = {'pad_top': 80, 'pad_bottom':30, 'border_thickness':8, 'border_color':"#aaaaaa", 'pad_color': bg_color}
title_data0 = {'position':'tc','title':'','font_scale':0.9, 'font_thickness':1, 'font_name':'duplex', 'font_bg_color':'', 'font_color':"#000000"}
title_data_svg0 = {'position':'tc','font_name':'Arial, sans-serif', 'font_size':24, 'font_color':'#000000', 'font_bg_color':'', 'font_weight':'normal'}


# A helper function to get, show and save Mermaid.js image (png/jpg) based diagrams
def get_show_and_save_image(diagram_code, format, file_name, title, theme='default', config={**config0}, options={**options0}, pad_data={**pad_data0}, title_data={**title_data0}):
  options['bgColor'] = options['bgColor'].replace('#', '')
  diagram = mm.get_mermaid_diagram(format, diagram_code, theme, config, options)
  title_data = {**title_data, 'title':title}
  diagramPBT = mm.add_paddings_border_and_title_to_image(diagram, pad_data, title_data)
  mm.show_image_pyplot(diagramPBT)
  if file_name!="":
    mm.save_diagram_as_image(f'{out_path}/{file_name}.{format}', diagramPBT)

  return diagramPBT


# A helper function to get, show and save Mermaid.js svg based diagrams
def get_show_and_save_svg(diagram_code, format, file_name, title, theme='default',  config={**config0}, options={**options0}, pad_data={**pad_data0}, title_data_svg={**title_data_svg0}):
  options['bgColor'] = options['bgColor'].replace('#', '')
  diagram = mm.get_mermaid_diagram(format, diagram_code, theme, config, options)
  title_data_svg = {**title_data_svg, 'title':title}
  diagramPBT = mm.add_paddings_border_and_title_to_svg(diagram, pad_data, title_data_svg)
  mm.show_svg_ipython(diagramPBT)
  if file_name!="":
    mm.save_diagram_as_svg(f'{out_path}/{file_name}.{format}', diagramPBT)

  return diagramPBT
# ===================================================================================================
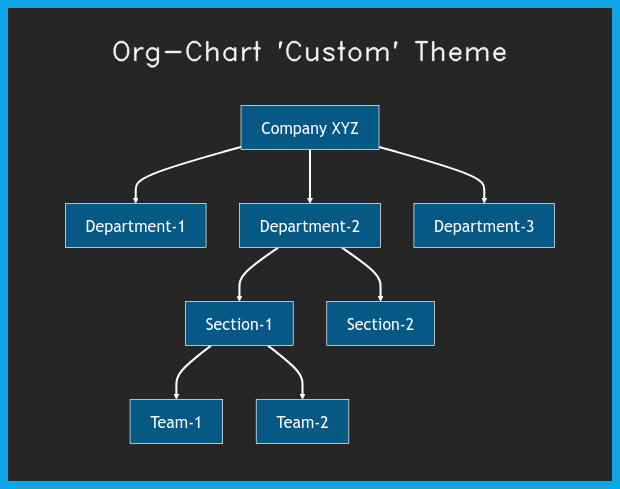
A flowchart with custom theme:
org_chart_code = """
flowchart TB
%% Nodes
    c[Company XYZ]
    d1[Department-1]
    d2[Department-2]
    d3[Department-3]
    d2s1[Section-1]
    d2s2[Section-2]
    d2s1t1[Team-1]
    d2s1t2[Team-2]

%% Links
    c --- d1
    c --- d2
    c --- d3
    d2 --- d2s1
    d2 --- d2s2
    d2s1 --- d2s1t1
    d2s1 --- d2s1t2
"""
config = {**config0, "flowchart": {"rankSpacing": 80}}
# "linkStyle default" is to set style for all Mermaid.js connector lines (strokes)
link_style_string = '''linkStyle default stroke:#ffffff,stroke-width:3px;'''
org_chart_code1 = org_chart_code + link_style_string

theme = {'primaryColor':'#075985',
         'primaryTextColor': '#ffffff',
         'lineColor': '#ffffff',
         'fontSize':'24px',
         'primaryBorderColor': '#ffffff'
        }
options = {**options0, 'bgColor':'#262626'}
title_data = {**title_data0, 'font_color':'#ffffff', 'title_margin_y':40}
pad_data = {**pad_data0, 'border_color': '#0ea5e9', 'pad_x':60, 'pad_top': 100, 'pad_bottom': 40, 'pad_color': options['bgColor']}
# The 'png' version of "Org-Chart 'Custom' Theme"
get_show_and_save_image(org_chart_code1, 'png', 'org-chart-custom-theme', "Org-Chart 'Custom' Theme", theme, options=options, config=config, title_data=title_data, pad_data=pad_data)
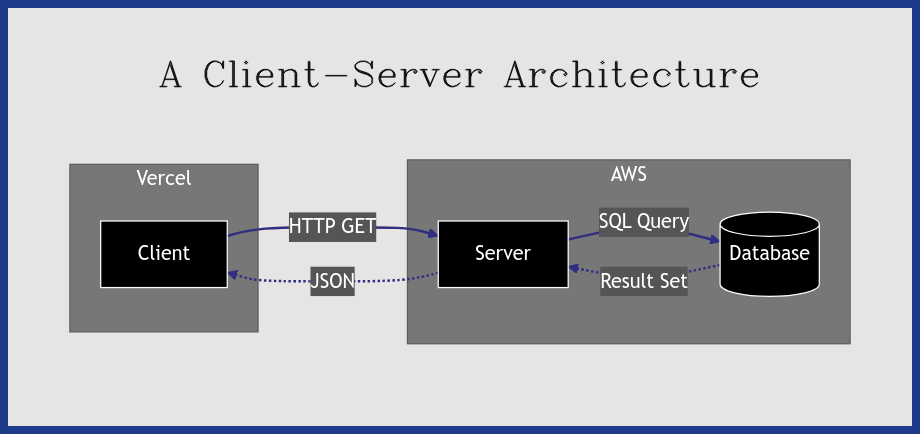
A Simple Client-Server Architecture:
# Example-8 Flowchart with Subgraphs to depict a typical client-server architecture (.png format)
client_server_diagram_code = '''
flowchart LR
    linkStyle default stroke-width:2px;
    subgraph Vercel
        c[Client]
    end    subgraph AWS
        s[Server]
        db[(Database)]
    end


    c -- HTTP GET --> s
    s -. JSON .-> c
    db -. Result Set .-> s
    s -- SQL Query --> db
'''
theme = {'primaryColor':'#000000',
         'secondaryColor':'#555555',
         'tertiaryColor':'#777777',
         'primaryTextColor': '#ffffff',
         'secondaryTextColor': '#ffffff',
         'tertiaryTextColor': '#ffffff',
         'primaryBorderColor': '#ffffff',
         'lineColor': "#312e81"
     }

options = {**options0, 'bgColor': '#e7e5e4', 'width': '800'}
pad_data = {**pad_data0, 'pad_color': options['bgColor'], 'border_color': "#1e3a8a", 'pad_x':60, 'pad_top': 150, 'pad_bottom': 80}
title_data = {**title_data0, 'font_color':'#000000', 'title_margin_y':60, 'font_scale':1.2, 'font_name':'complex'}
get_show_and_save_image(client_server_diagram_code, 'png', 'client-server architecture', "A Client-Server Architecture", theme, config = config0, options=options, title_data=title_data, pad_data=pad_data)
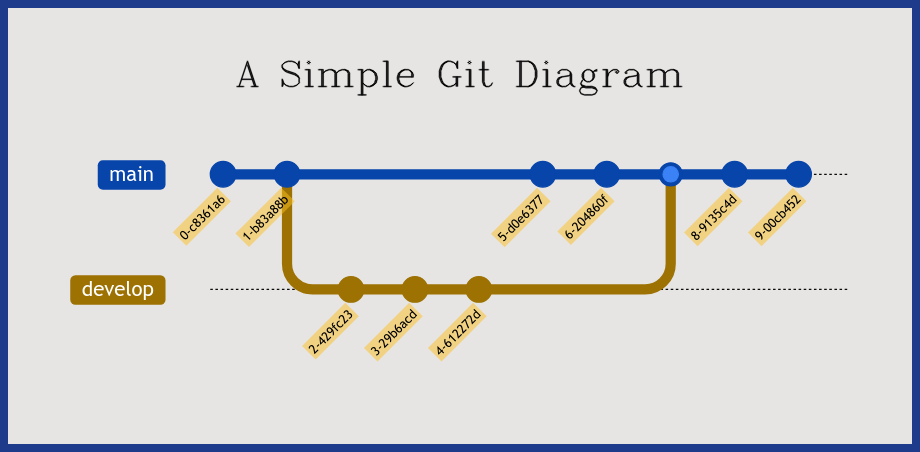
A Simple Git Diagram:
# Example-7 A Simple Git Diagram (.png format)

git_diagram_code = '''
    gitGraph LR:
       commit
       commit
       branch develop
       commit
       commit
       commit
       checkout main
       commit
       commit
       merge develop
       commit
       commit
'''

theme = {'primaryColor':'#3b82f6',
         'primaryTextColor': '#ffffff',
         'secondaryColor':'#fbbf24',
         'secondaryTextColor': '#000000',
         'fontSize':'16px',
        }

options = {**options0, 'bgColor': '#e7e5e4','width':'800px'}
title_data = {**title_data0, 'font_color':'#000000', 'title_margin_y':60, 'font_scale':1.2, 'font_name':'complex'}
pad_data = {**pad_data0, 'border_thickness':8, 'border_color': '#1e3a8a', 'pad_x':60, 'pad_top': 150, 'pad_bottom': 80, 'pad_color': options['bgColor']}

get_show_and_save_image(git_diagram_code, 'png', 'a-simple-git-diagram', "A Simple Git Diagram", theme, config = config0, options=options, title_data=title_data, pad_data=pad_data)
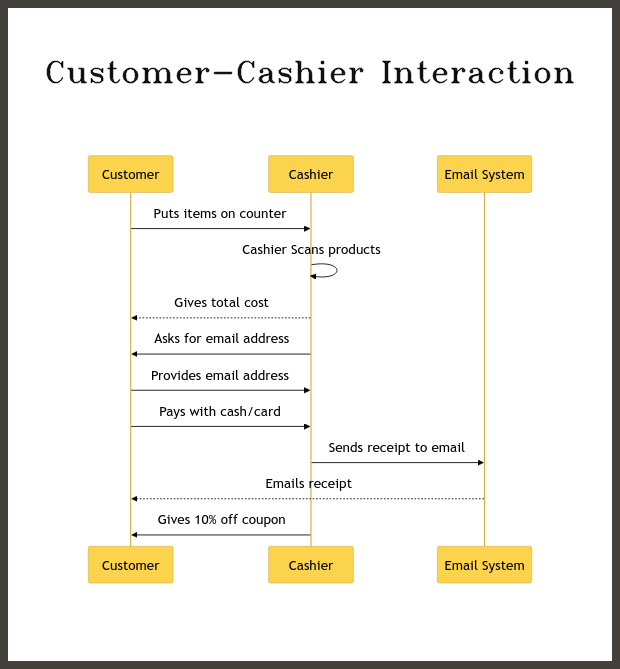
Sequence Diagram for a Customer Cashier Interaction:
# Example-9  A customer-cashier interaction "Sequence Diagram" (.png format)
interaction_diagram_code = '''
sequenceDiagram
  participant C as Customer
  participant CH as Cashier
  participant E as Email System

  C->>CH:  Puts items on counter
  CH->>CH: Cashier Scans products
  CH-->>C: Gives total cost
  CH->>C: Asks for email address
  C->>CH: Provides email address
  C->>CH: Pays with cash/card
  CH->>E: Sends receipt to email
  E-->>C: Emails receipt
  CH->>C: Gives 10% off coupon
'''
theme = {'primaryColor':'#fcd34d',
         'tertiaryColor':'#fcd34d',
         'primaryTextColor': '#000000',
        }

options = {**options0, 'bgColor': '#ffffff'}
pad_data = {**pad_data0, 'pad_color': options['bgColor'], 'border_color': "#44403c", 'pad_x':60, 'pad_top': 150, 'pad_bottom': 80}
title_data = {**title_data0, 'font_color':'#000000', 'title_margin_y':60, 'font_scale':1.0, 'font_name':'triplex'}
get_show_and_save_image(interaction_diagram_code, 'png', 'customer-cashier-interaction', "Customer-Cashier Interaction", theme, config = config0, options=options, title_data=title_data, pad_data=pad_data)
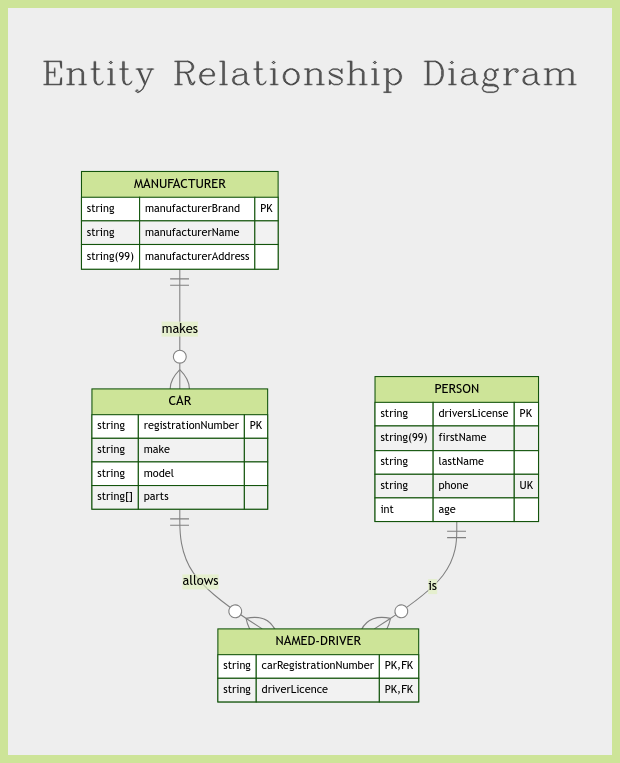
A Simple Entity Relationship Diagram (ERD):
# Example-10 A Simple Entity Relationship Diagram (ERD)
erd_code = '''
    erDiagram
    CAR ||--o{ NAMED-DRIVER : allows
    CAR {
        string registrationNumber PK
        string make
        string model
        string[] parts
    }
    PERSON ||--o{ NAMED-DRIVER : is
    PERSON {
        string driversLicense PK
        string(99) firstName
        string lastName
        string phone UK
        int age
    }
    NAMED-DRIVER {
        string carRegistrationNumber PK, FK
        string driverLicence PK, FK
    }
    MANUFACTURER ||--o{ CAR : makes
    MANUFACTURER {
        string manufacturerBrand PK
        string manufacturerName
        string(99) manufacturerAddress
    }
'''

options = {**options0, 'bgColor': '#eeeeee'}
pad_data = {**pad_data0, 'pad_color': options['bgColor'], 'border_color': "#cde498", 'pad_x':60, 'pad_top': 150, 'pad_bottom': 40}
title_data = {**title_data0, 'font_color':'#444444', 'title_margin_y':60, 'font_scale':1.1, 'font_name':'complex'}
get_show_and_save_image(erd_code, 'png', 'entity relationship diagram', "Entity Relationship Diagram", 'forest', config = config0, options=options, title_data=title_data, pad_data=pad_data)
Conclusions
-
mermaidian is a set of Python functions that enable users to easily use Mermaid.js diagramming capabilities from Python. It provides a simple way to include custom theme variables in a dict form. Other image options can also be specified as key-value pairs in a dict.
-
Mermaidian enhances Mermaid.js by providing simple functions to add custom paddings, border and title to the diagrams returned from mermaid.ink. For IPython users, it also provides functions for centralizing displaying of the diagrams.
-
The core Mermaid.js syntax is preserved, therefore most of the Mermaid.js documentation can be referred for syntax and configuration details.
License
This project is licensed under the terms of the MIT license
References
-
Mermaid Diagramming and charting tool. https://mermaid.js.org/
-
Mermaid Ink. https://mermaid.ink/
-
Mermaid Theme Configuration. https://mermaid.js.org/config/theming.html.
-
Mermaid: Flowcharts - Basic Syntax. https://mermaid.js.org/syntax/flowchart.html


Download files
Download the file for your platform. If you're not sure which to choose, learn more about installing packages.
Source Distribution
Built Distribution
Filter files by name, interpreter, ABI, and platform.
If you're not sure about the file name format, learn more about wheel file names.
Copy a direct link to the current filters
File details
Details for the file mermaidian-0.1.2.tar.gz.
File metadata
- Download URL: mermaidian-0.1.2.tar.gz
- Upload date:
- Size: 20.7 kB
- Tags: Source
- Uploaded using Trusted Publishing? No
- Uploaded via: twine/5.1.1 CPython/3.12.7
File hashes
| Algorithm | Hash digest | |
|---|---|---|
| SHA256 |
3efbcb9771c38a607ca4c708f25a2e1d0d439d661d20df19c024fda83ed2e67d
|
|
| MD5 |
fa4b23734fda05b14d02b7526568c786
|
|
| BLAKE2b-256 |
86b22d622dacc9716d1578b8b31be64c9c60f425b03ddeb812622f701cc6a944
|
File details
Details for the file mermaidian-0.1.2-py3-none-any.whl.
File metadata
- Download URL: mermaidian-0.1.2-py3-none-any.whl
- Upload date:
- Size: 16.5 kB
- Tags: Python 3
- Uploaded using Trusted Publishing? No
- Uploaded via: twine/5.1.1 CPython/3.12.7
File hashes
| Algorithm | Hash digest | |
|---|---|---|
| SHA256 |
041de2a53e26ceb03703c782da7fec088a885b7cb84827d2e70b6328bf58d6a1
|
|
| MD5 |
a7bdb0ba2abcef882a142954a876143f
|
|
| BLAKE2b-256 |
f144331959d6ef88e0847d795de046af506f7ba4db33818e4e4c5be47c722902
|


