the package fits data to metalog distribution and generates samples, quantiles, densities and probabilities based on the fitted distribution.

Project description
Sergey Kim, Reidar Brumer Bratvold
Metalog Distribution
The metalog distributions constitute a new system of continuous univariate probability distributions designed for flexibility, simplicity, and ease/speed of use in practice. The system is comprised of unbounded, semi-bounded, and bounded distributions, each of which offers nearly unlimited shape flexibility compared to Pearson, Johnson, and other traditional systems of distributions.
The package requires the following packages: numpy, pandas, matplotlib and scipy (ver 1.3.1).
The following paper and website provide a full background of the metalog distribution.
Using the Package
This Python package was transfered from RMetalog package by Isaac J. Faber and therefore shares the same R-based structure.
The data used for demonstration are body length of salmon and were collected in 2008-2010:
import numpy as np
import pandas as pd

salmon = pd.read_csv("Chinook and forage fish lengths.csv")

# Filtered data for eelgrass vegetation and chinook salmon
salmon = salmon[(salmon['Vegetation'] == 'Eelgrass') & (salmon['Species'] == 'Chinook_salmon')]
salmon = np.array(salmon['Length'])
To import package with metalog distribution run the code:
from metalog import metalog
To fit the data to metalog distribution one should use function metalog.fit(). It has the following arguments:
x: data.
bounds: bounds of metalog distribution. Depending on boundedness argument can take zero, one or two values.
boundedness: boundedness of metalog distribution. Can take values 'u' for unbounded, 'sl' for semi-bounded lower, 'su' for semi-bounded upper and 'b' for bounded on both sides.
term_limit: maximum number of terms to specify the metalog distribution. Can take values from 3 to 30.
term_lower_bound: the lowest number of terms to specify the metalog distribution. Must be greater or equal to 2 and less than term_limit. The argument is optional. Default value is 2.
step_len: size of steps to summarize the distribution. The argument is optional. Default value is 0.01.
probs: probabilities corresponding to data. The argument is optional. Default value is numpy.nan.
fit_method: fit method 'OLS', 'LP' or 'any'. The argument is optional. Default value is 'any'.
save_data: if True then data will be saved for future update. The argument is optional. Default values is False.
Fit metalog distribution to data and store the result to variable metalog_salmon. The distribution is bounded on both sides: from 0 to 200. Term limit is set to 10:
metalog_salmon = metalog.fit(x=salmon, boundedness='b', bounds=[0, 200], term_limit=10)
To get summary of distribution call the following function with only one argument m - the variable that stores fitted metalog distribution:
metalog.summary(m=metalog_salmon)
Output:
 -----------------------------------------------
 SUMMARY OF METALOG DISTRIBUTION OBJECT
 -----------------------------------------------

PARAMETERS

 Term Limit:  10
 Term Lower Bound:  2
 Boundedness:  b
 Bounds (only used based on boundedness):  [0, 200]
 Step Length for Distribution Summary:  0.01
 Method Use for Fitting:  any
 Number of Data Points Used:  138
 Original Data Saved:  False


VALIDATION AND FIT METHOD

     term valid method
2      2   yes    OLS
3      3   yes    OLS
4      4   yes    OLS
5      5   yes    OLS
6      6   yes    OLS
7      7   yes    OLS
8      8   yes    OLS
9      9   yes    OLS
10    10   yes    OLS
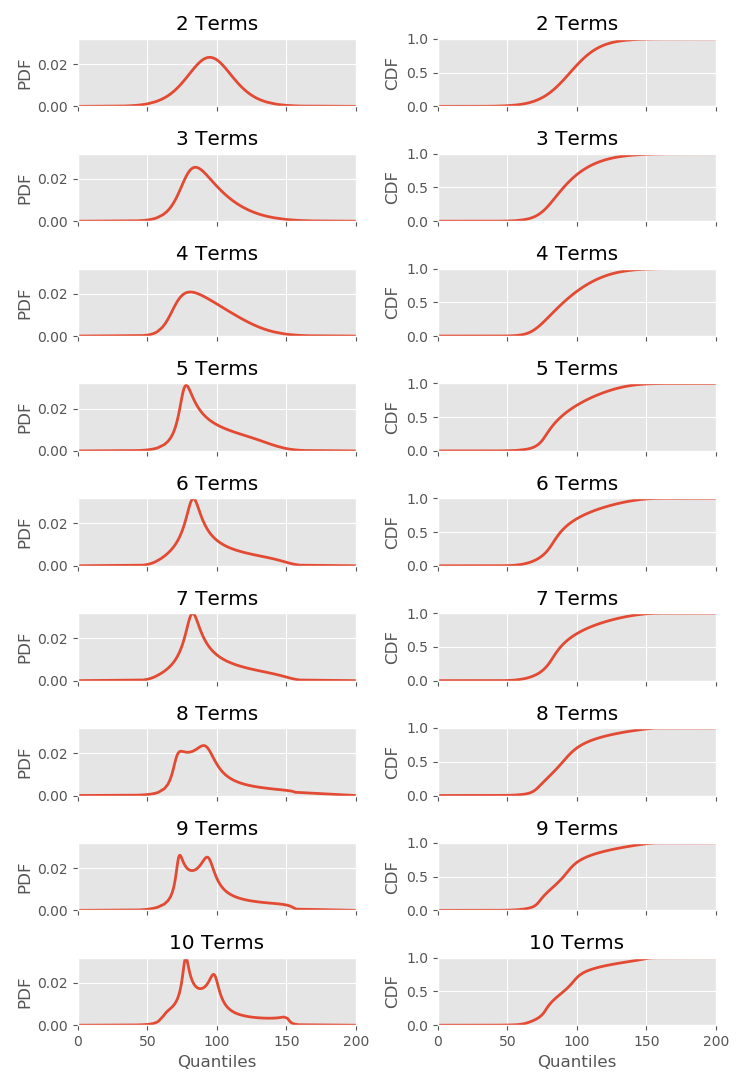
It’s possible to plot corresponding PDF and CDF of metalog distribution:
metalog.plot(m=metalog_salmon)
Output:
To draw samples from distribution use metalog.r() function where n is number of samples and term specifies the terms of distribution to sample from:
metalog.r(m=metalog_salmon, n=5, term=10)
Output:
array([73.81897286, 86.74055734, 84.22509619, 83.80426247, 97.79800677])
To get densities based on quantiles type metalog.d() function where q is vector of quantiles:
metalog.d(m=metalog_salmon, q=[50, 110, 150], term=10)
Output:
array([0.00038265, 0.00712032, 0.00373991])
To calculate probabilities based on quantiles use metalog.p() function:
metalog.p(m=metalog_salmon, q=[50, 110, 150], term=10)
Output:
array([0.00275336, 0.82349578, 0.98686581])
Finally, to get quantiles from probabilites input metalog.q():
metalog.q(m=metalog_salmon, y=[0.00275336, 0.82349578, 0.98686581], term=10)
Output:
array([ 50.02583336, 109.99861143, 149.99737059])
Release history Release notifications | RSS feed

Download files
Download the file for your platform. If you're not sure which to choose, learn more about installing packages.
Source Distribution
Built Distribution
Filter files by name, interpreter, ABI, and platform.
If you're not sure about the file name format, learn more about wheel file names.
Copy a direct link to the current filters
File details
Details for the file metalog-0.2.2.tar.gz.
File metadata
- Download URL: metalog-0.2.2.tar.gz
- Upload date:
- Size: 13.4 kB
- Tags: Source
- Uploaded using Trusted Publishing? No
- Uploaded via: twine/1.14.0 pkginfo/1.5.0.1 requests/2.21.0 setuptools/40.8.0 requests-toolbelt/0.9.1 tqdm/4.31.1 CPython/3.7.3
File hashes
| Algorithm | Hash digest | |
|---|---|---|
| SHA256 |
187f8888d63d8c8c09358b70a9a5d2ca5b0783d9f22166c93ac9c03f530c269d
|
|
| MD5 |
9e38203f45aff956245dedb1485dcd67
|
|
| BLAKE2b-256 |
1d7accba674e373e4f00842c253a3ceed11b8d03e3b51cb5d892ad2e04b25ff4
|
File details
Details for the file metalog-0.2.2-py3-none-any.whl.
File metadata
- Download URL: metalog-0.2.2-py3-none-any.whl
- Upload date:
- Size: 12.9 kB
- Tags: Python 3
- Uploaded using Trusted Publishing? No
- Uploaded via: twine/1.14.0 pkginfo/1.5.0.1 requests/2.21.0 setuptools/40.8.0 requests-toolbelt/0.9.1 tqdm/4.31.1 CPython/3.7.3
File hashes
| Algorithm | Hash digest | |
|---|---|---|
| SHA256 |
e7b5aa6ccaf25d23f272add2d49f10ac2b9041c73be84d22bb04bc87ffc3edd8
|
|
| MD5 |
5f77eee7cd6f692d8844b06ee555ca85
|
|
| BLAKE2b-256 |
441c82505e6df4a1995fea83c6b07869ecfc2e3c231bab88498e7acd467ce1c1
|


