Prometheus Exporter for Mikrotik RouterOS devices

Project description


Description
MKTXP is a Prometheus Exporter for Mikrotik RouterOS devices.
It gathers and exports a rich set of metrics across multiple routers, all easily configurable via built-in CLI interface.
While simple to use, MKTXP supports advanced features such as automatic IP address resolution with both local & remote DHCP servers, concurrent exports across multiple router devices, configurable data processing & transformations, injectable custom labels for easy device grouping, optional bandwidth testing, support for Prometheus multi-target dynamic discovery, etc.
Apart from exporting to Prometheus, MKTXP can print selected metrics directly on the command line (see examples below).
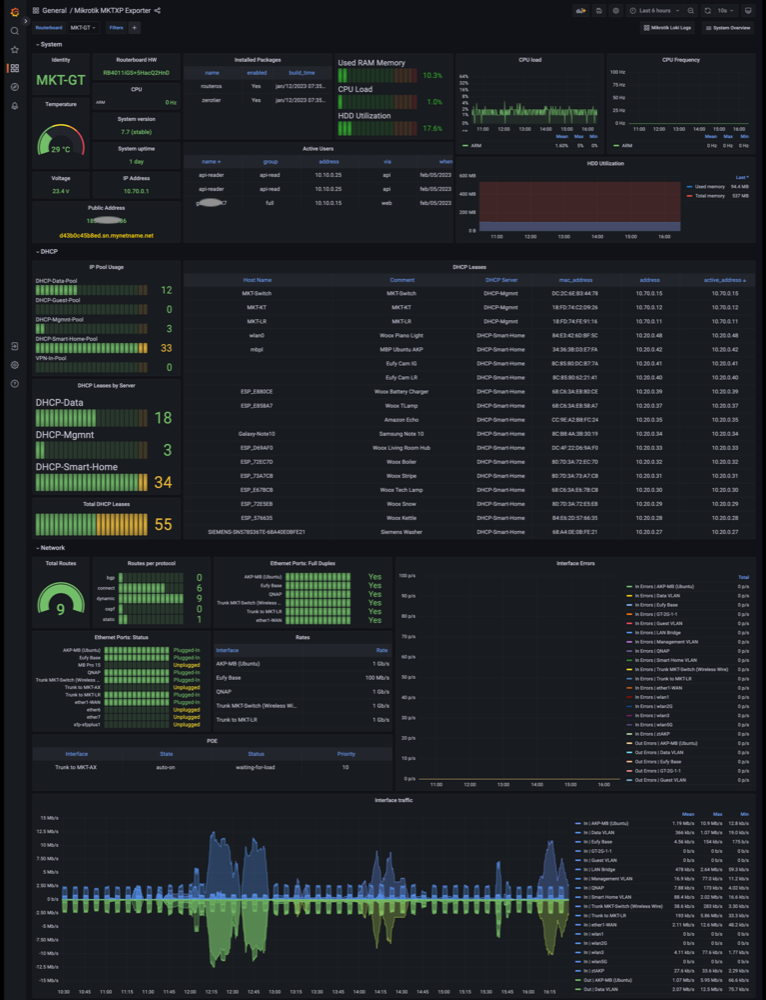
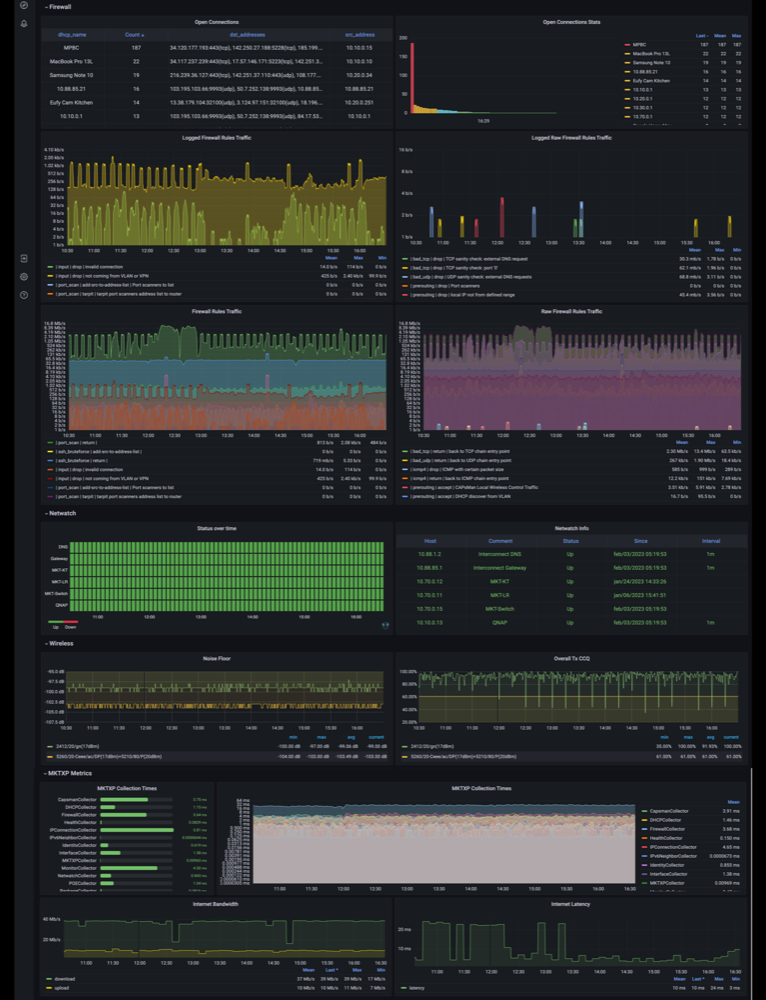
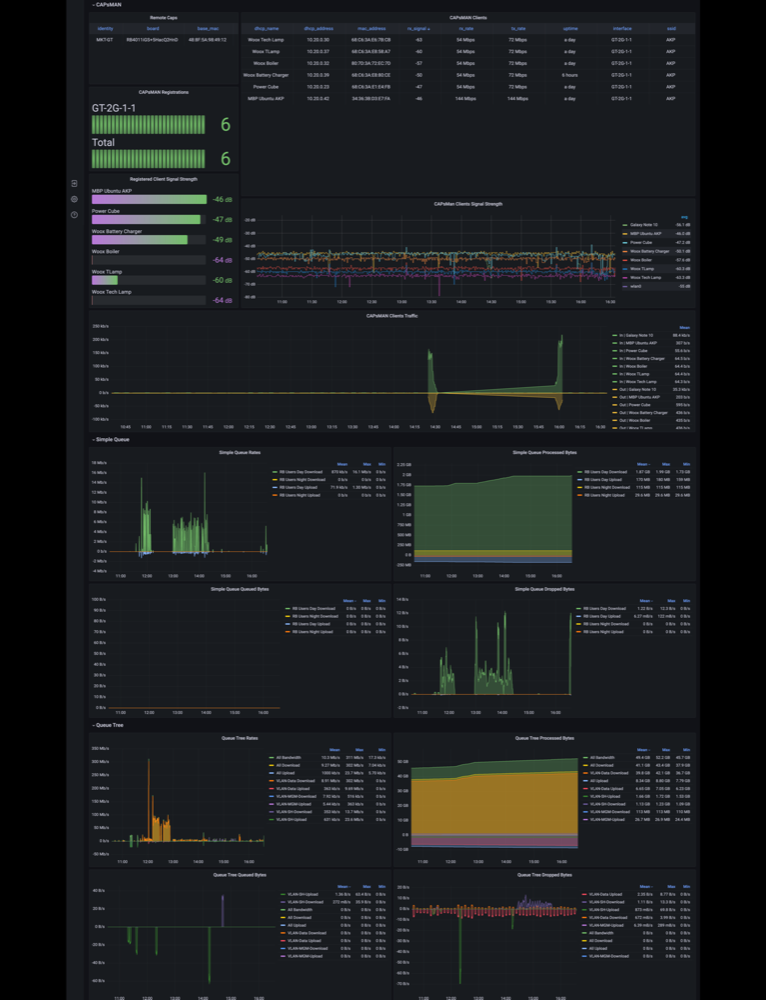
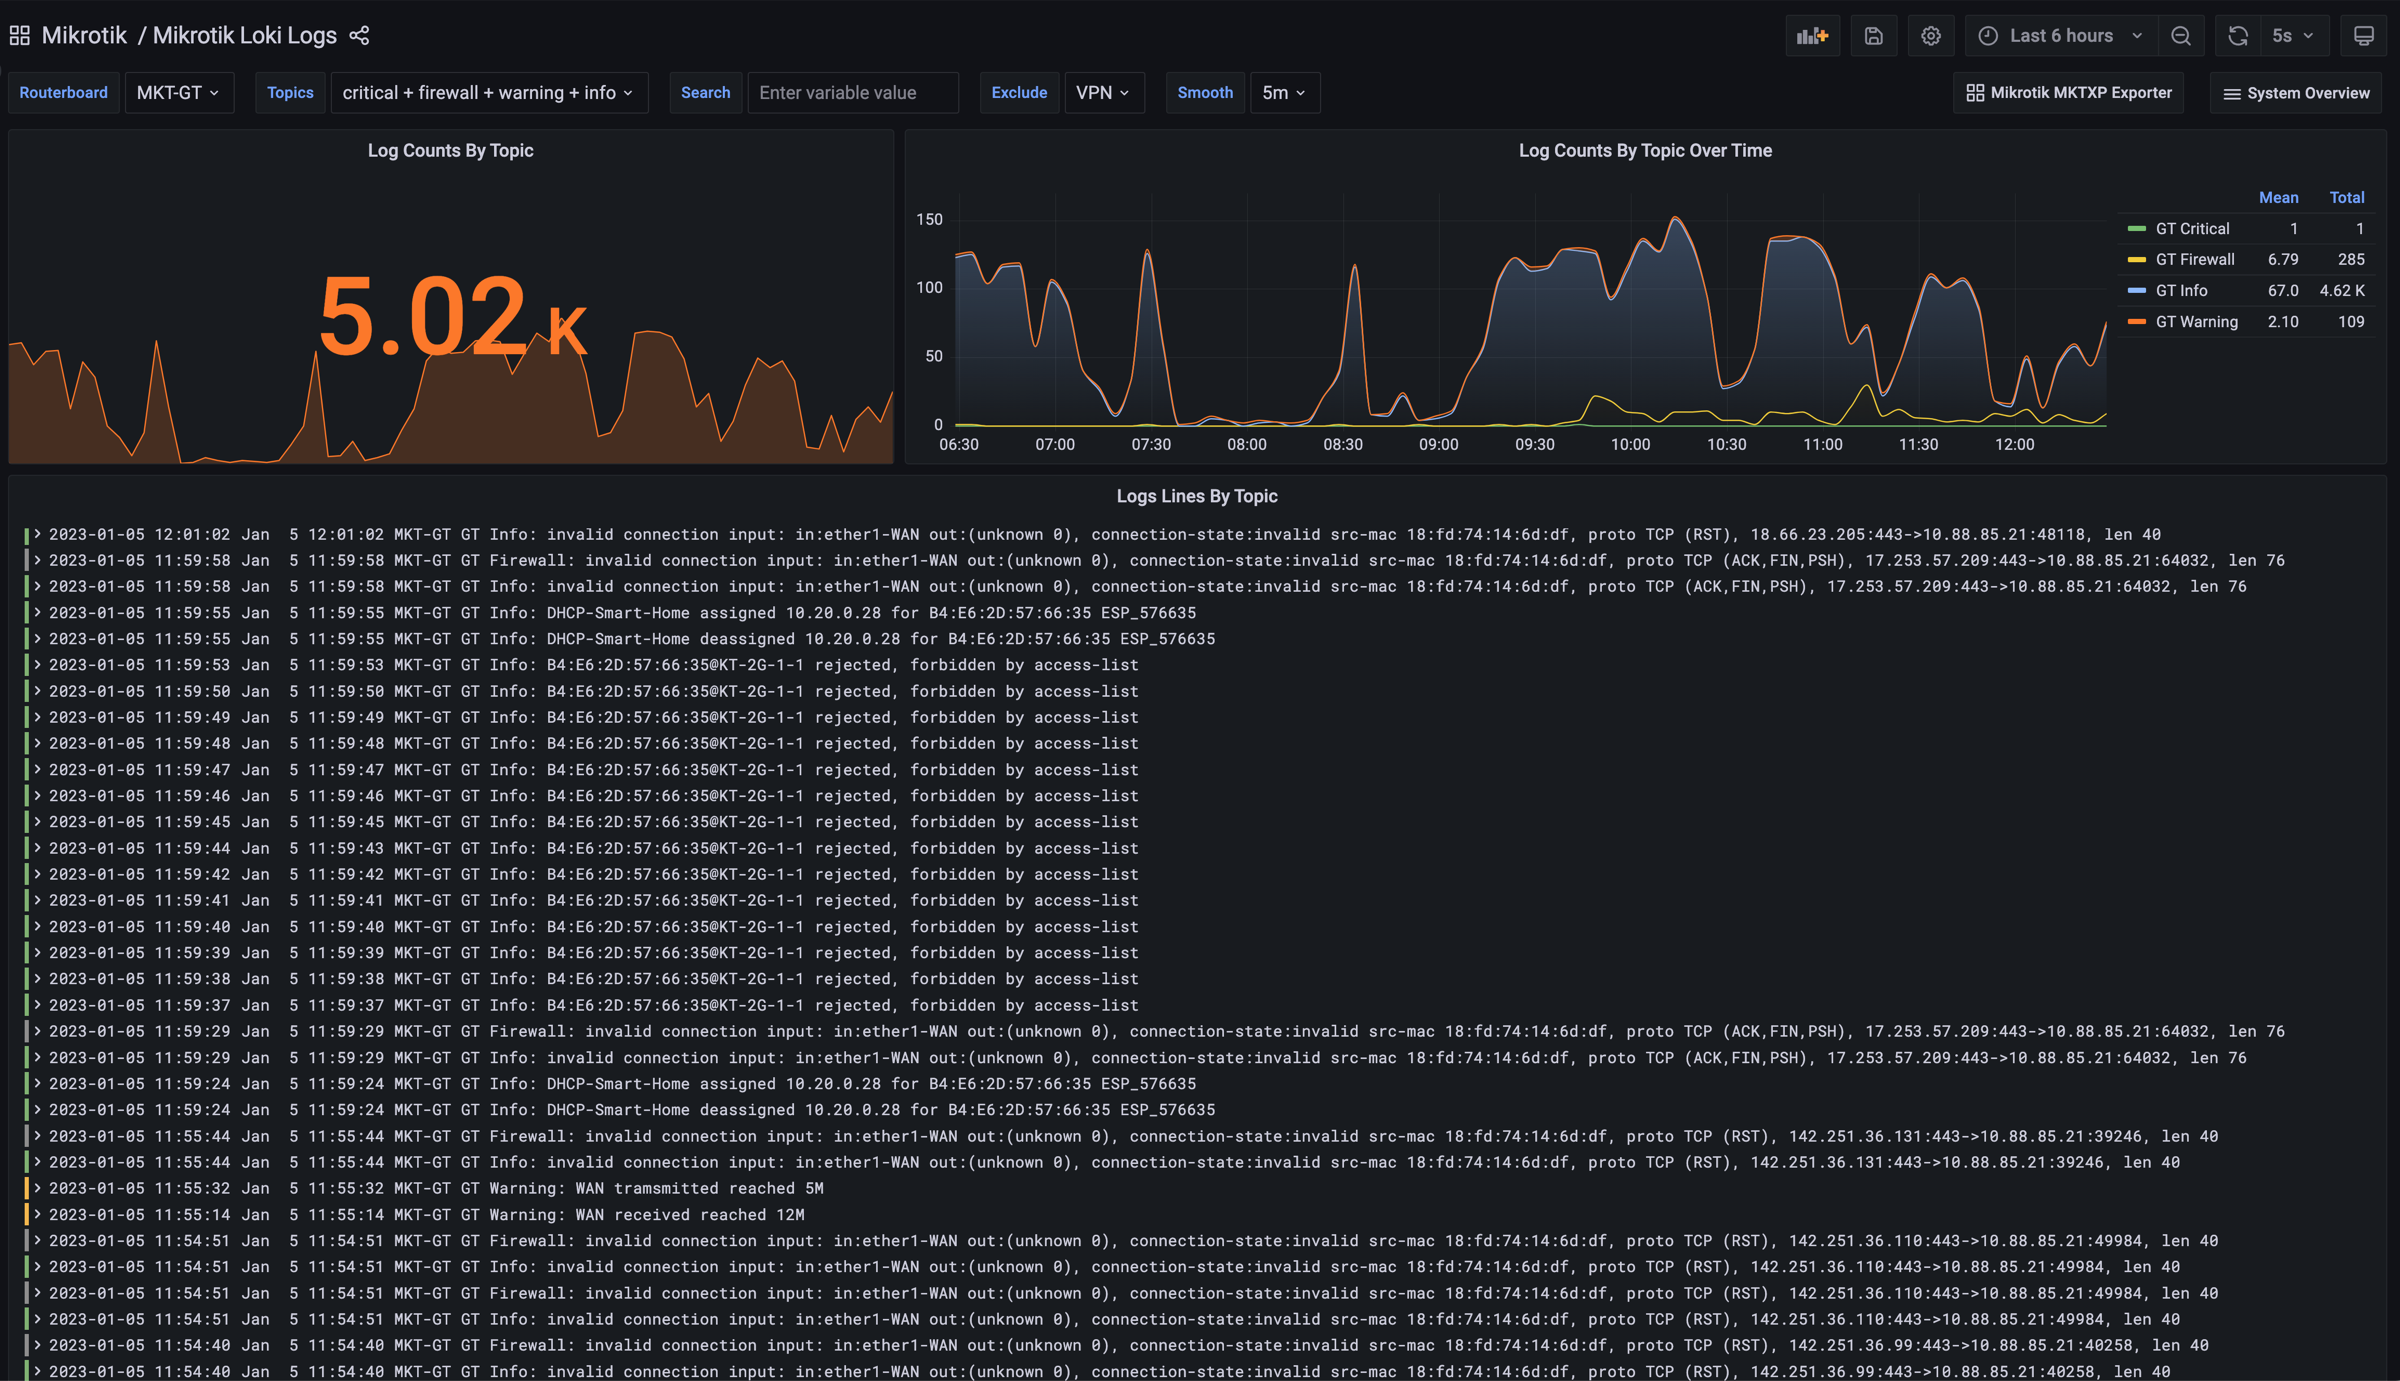
For effortless visualization of the RouterOS metrics exported to Prometheus, MKTXP comes with a dedicated Grafana dashboard:
Requirements:
-
Supported OSs:
- Linux
- Mac OSX
- FreeBSD
-
Mikrotik RouterOS device(s)
-
Optional:
Install:
There are multiple ways to install this project, from a standalone app to a fully dockerized monitoring stack. The supported options include:
-
MKTXP Stack: a mktxp companion project, that provides ready-to-go MKTXP monitoring stack along with added Mikrotik centralized log processing:
-
from Docker image :
❯ docker pull ghcr.io/akpw/mktxp:latest -
from PyPI:
❯ pip install mktxp -
latest from source repository:
❯ pip install git+https://github.com/akpw/mktxp -
with the sample Kubernetes deployment
Getting started
To get started with MKTXP, you need to edit its main configuration file. This essentially involves filling in your Mikrotik devices IP addresses & authentication info, optionally modifying various settings to specific needs.
The default configuration file comes with a sample configuration, making it easy to copy / edit parameters for your RouterOS devices as needed:
[Sample-Router-1]
    # for specific configuration on the router level, overload the defaults here
    hostname = 192.168.88.1
    custom_labels = dc:london, rack=a1, service:prod

[Sample-Router-2]
    # for specific configuration on the router level, overload the defaults here
    hostname = 192.168.88.2

[default]
    # this affects configuration of all routers, unless overloaded on their specific levels

    enabled = True          # turns metrics collection for this RouterOS device on / off
    module_only = False     # use this entry only as a probe module (skip /metrics collection)
    hostname = localhost    # RouterOS IP address
    port = 8728             # RouterOS IP Port

    username = username     # RouterOS user, needs to have 'read' and 'api' permissions
    password = password
    credentials_file = ""   # To use an external file in YAML format for both username and password, specify the path here

    custom_labels = None    # Custom labels to be injected to all device metrics, comma-separated key:value (or key=value) pairs
                            # Example: 'dc:london, rack=a1, service:prod' (quotation marks are optional)

    use_ssl = False                 # enables connection via API-SSL servis
    no_ssl_certificate = False      # enables API_SSL connect without router SSL certificate
    ssl_certificate_verify = False  # turns SSL certificate verification on / off
    ssl_check_hostname = True       # check if the hostname matches the peer cert’s hostname
    ssl_ca_file = ""                # path to the certificate authority file to validate against, leave empty to use system store
    plaintext_login = True          # for legacy RouterOS versions below 6.43 use False

    routerboard = False             # RouterBOARD inventory / firmware metrics
    health = True                   # System Health metrics
    installed_packages = True       # Installed packages
    dhcp = True                     # DHCP general metrics
    dhcp_lease = True               # DHCP lease metrics

    connections = True              # IP connections metrics
    connection_stats = False        # Open IP connections metrics
    connection_stats_destinations = False   # Set to True to track individual destination IPs/ports (Warning: High Cardinality)

    interface = True                # Interfaces traffic metrics
    wireguard_peers = False         # Wireguard peers metrics
    bridge_vlan = False             # Bridge VLAN metrics

    route = True                    # IPv4 Routes metrics
    pool = True                     # IPv4 Pool metrics
    firewall = True                 # IPv4 Firewall rules traffic metrics
    neighbor = True                 # IPv4 Reachable Neighbors
    address_list = None             # Firewall Address List metrics, a comma-separated list of names
    dns = False                     # DNS stats

    ipv6_route = False              # IPv6 Routes metrics
    ipv6_pool = False               # IPv6 Pool metrics
    ipv6_firewall = False           # IPv6 Firewall rules traffic metrics
    ipv6_neighbor = False           # IPv6 Reachable Neighbors
    ipv6_address_list = None        # IPv6 Firewall Address List metrics, a comma-separated list of names

    poe = True                      # POE metrics
    monitor = True                  # Interface monitor metrics
    netwatch = True                 # Netwatch metrics
    public_ip = True                # Public IP metrics
    wireless = True                 # WLAN general metrics
    wireless_clients = True         # WLAN clients metrics
    capsman = True                  # CAPsMAN general metrics
    capsman_clients = True          # CAPsMAN clients metrics
    w60g = False                    # W60G metrics

    eoip = False                    # EoIP status metrics
    gre = False                     # GRE status metrics
    ipip = False                    # IPIP status metrics
    lte = False                     # LTE signal and status metrics (requires additional 'test' permission policy on RouterOS v6)
    ipsec = False                   # IPSec active peer metrics
    switch_port = False             # Switch Port metrics

    kid_control_assigned = False    # Allow Kid Control metrics for connected devices with assigned users
    kid_control_dynamic = False     # Allow Kid Control metrics for all connected devices, including those without assigned user

    user = True                     # Active Users metrics
    queue = True                    # Queues metrics

    bfd = False                     # BFD sessions metrics
    bgp = False                     # BGP sessions metrics
    routing_stats = False           # Routing process stats
    certificate = False             # Certificates metrics

    container = False               # Containers metrics

    remote_dhcp_entry = None        # An MKTXP entry to provide for remote DHCP info / resolution
    remote_capsman_entry = None     # An MKTXP entry to provide for remote capsman info

    interface_name_format = name    # Format to use for interface / resource names, allowed values: 'name', 'comment', or 'combined'
                                        # 'name': use interface name only (e.g. 'ether1')
                                        # 'comment': use comment if available, fallback to name if not
                                        # 'combined': use both (e.g. 'ether1 (Office Switch)')
    check_for_updates = False       # check for available ROS updates
Most options are easy to understand at first glance, and some are described in more details later.
💡 To automatically migrate from the older mktxp.conf format in the existing installs, just set compact_default_conf_values = True in the mktxp system config
Local install
If you have a local MKTXP installation, you can edit the configuration file with your default system editor directly from mktxp:
❯ mktxp edit
In case you prefer a different editor, run the edit command with its optional -ed parameter:
❯ mktxp edit -ed nano
Obviously, you can do the same via just opening the config file directly:
❯ nano ~/mktxp/mktxp.conf
Docker image install
The MKTXP Docker image runs as UID 1000 (standard user ID on most Linux distributions) to simplify file permissions when bind-mounting configuration files.
💡 Docker images are available at https://github.com/akpw/mktxp/pkgs/container/mktxp. Use :main for the latest features or :latest for the most recent stable release.
For Docker instances, you have several options for managing configuration:
Option 1: Using /etc/mktxp (Recommended)
# Create config directory and files
mkdir mktxp-config
nano mktxp-config/mktxp.conf     # copy&edit sample entry(ies) from above
nano mktxp-config/_mktxp.conf    # optional: system configuration

# Run with dedicated config directory
docker run -v "$(pwd)/mktxp-config:/etc/mktxp" -p 49090:49090 -it --rm \
  ghcr.io/akpw/mktxp:main mktxp --cfg-dir /etc/mktxp export
Option 2: Mount individual files
# Create config files
nano mktxp.conf  # copy&edit sample entry(ies) from above

# Mount only the config file (internal _mktxp.conf will be auto-created)
docker run -v "$(pwd)/mktxp.conf:/etc/mktxp/mktxp.conf" -p 49090:49090 -it --rm \
  ghcr.io/akpw/mktxp:main mktxp --cfg-dir /etc/mktxp export
Option 3: Legacy home directory method (backward compatible)
mkdir mktxp
nano mktxp/mktxp.conf  # copy&edit sample entry(ies) from above

# Traditional mounting to home directory
docker run -v "$(pwd)/mktxp:/home/mktxp/mktxp/" -p 49090:49090 -it --rm \
  ghcr.io/akpw/mktxp:main
Getting shell access for debugging:
# Easy shell access (no --entrypoint needed)
docker run -v "$(pwd)/mktxp-config:/etc/mktxp" -it --rm ghcr.io/akpw/mktxp:main sh
MKTXP stack install
MKTXP Stack Getting Started provides similar instructions around editing the mktxp.conf file and, if needed, adding a dedicated API user to your Mikrotik RouterOS devices as mentioned below.
💡 In the case of usage within a Docker Swarm, please do make sure to have all settings explicitly set in both the mktxp.conf and _mktxp.conf files. Not doing this may cause issues regarding a read-only filesystem.
Mikrotik Device Config
For the purpose of RouterOS device monitoring, it's best to create a dedicated user with minimal required permissions.
MKTXP only needs API and Read💡, so at that point you can go to your router's terminal and type:
/user group add name=mktxp_group policy=api,read
/user add name=mktxp_user group=mktxp_group password=mktxp_user_password
💡 For the LTE metrics on RouterOS v6, the mktxp user will also need the test permission policy.
A check on reality
Now let's put some Mikrotik device address / user credentials in the above MKTXP configuration file, and at that point we should already be able to check out on our progress so far. Since MKTXP can output selected metrics directly on the command line with the mktxp print command, it's easy to do it even without Prometheus or Grafana.
For example, let's go take a look at some of my smart home CAPsMAN clients:
 ❯ mktxp print -en MKT-GT -cc
Connecting to router MKT-GT@10.**.*.**
2021-01-24 12:04:29 Connection to router MKT-GT@10.**.*.** has been established

| dhcp_name            | dhcp_address   | mac_address       |   rx_signal | interface   | ssid   | tx_rate   | rx_rate   | uptime   |
|----------------------|----------------|-------------------|-------------|-------------|--------|-----------|-----------|----------|
| Woox Runner          | 10.**.*.**     | 80:*************D |         -64 | LR-2G-1-1   | AKP    | 72 Mbps   | 54 Mbps   | 3 days   |
| Woox Office Lamp     | 10.**.*.**     | 80:*************F |         -59 | LR-2G-1-1   | AKP    | 72 Mbps   | 54 Mbps   | 3 days   |
| Harmony Hub          | 10.**.*.**     | C8:*************5 |         -46 | LR-2G-1-1   | AKP    | 72 Mbps   | 72 Mbps   | 3 days   |
| Woox Office Hub      | 10.**.*.**     | DC:*************7 |         -44 | LR-2G-1-1   | AKP    | 72 Mbps   | 54 Mbps   | 3 days   |
| Woox Ext Hub         | 10.**.*.**     | DC:*************E |         -44 | LR-2G-1-1   | AKP    | 72 Mbps   | 54 Mbps   | 3 days   |
| Amazon Echo          | 10.**.*.**     | CC:*************4 |         -44 | LR-2G-1-1   | AKP    | 72 Mbps   | 72 Mbps   | a day    |
| Woox Living Room Hub | 10.**.*.**     | DC:*************0 |         -43 | LR-2G-1-1   | AKP    | 72 Mbps   | 54 Mbps   | 3 days   |
| JBL View             | 10.**.*.**     | 00:*************D |         -28 | LR-2G-1-1   | AKP    | 144 Mbps  | 117 Mbps  | 7 hours  |
|                      |                |                   |             |             |        |           |           |          |
| MBP15                | 10.**.*.**     | 78:*************E |         -53 | GT-5G-1     | AKP5G  | 877 Mbps  | 877 Mbps  | 3 days   |
|                      |                |                   |             |             |        |           |           |          |
| Woox Toaster         | 10.**.*.**     | 68:*************B |         -70 | KT-2G-1-1   | AKP    | 72 Mbps   | 54 Mbps   | 3 days   |
| Woox Kettle          | 10.**.*.**     | B4:*************5 |         -65 | KT-2G-1-1   | AKP    | 65 Mbps   | 54 Mbps   | 2 days   |
| Woburn White         | 10.**.*.**     | 54:*************6 |         -59 | KT-2G-1-1   | AKP    | 72 Mbps   | 72 Mbps   | 9 hours  |
| Siemens Washer       | 10.**.*.**     | 68:*************1 |         -57 | KT-2G-1-1   | AKP    | 72 Mbps   | 72 Mbps   | 2 days   |
| Woburn Black         | 10.**.*.**     | 54:*************8 |         -57 | KT-2G-1-1   | AKP    | 72 Mbps   | 72 Mbps   | 9 hours  |
| Google Nest Display  | 10.**.*.**     | 1C:*************A |         -49 | KT-2G-1-1   | AKP    | 52 Mbps   | 43 Mbps   | 8 hours  |
-----------------------  --
Connected Wifi Devices:  15
-----------------------  --
Hmmm, that toaster could probably use a better signal... :)
But let's get back on track and proceed with the business of exporting RouterOS metrics to Prometheus.
Exporting to Prometheus
For getting your routers' metrics into an existing Prometheus installation, we basically just need to connect MKTXP to it.
Let's do just that via editing the Prometheus config file:
❯ nano /etc/prometheus/prometheus.yml
and simply add:
  - job_name: 'mktxp'
    static_configs:
      - targets: ['mktxp_machine_IP:49090']
At that point, we should be all ready for running the main mktxp export command that will be gathering router(s) metrics as configured above and serving them to Prometheus via a http server on the default port 49090. \
❯ mktxp export
Connecting to router MKT-GT@10.**.*.**
2021-01-24 14:16:22 Connection to router MKT-GT@10.**.*.** has been established
Connecting to router MKT-LR@10.**.*.**
2021-01-24 14:16:23 Connection to router MKT-LR@10.**.*.** has been established
2021-01-24 14:16:23 Running HTTP metrics server on port 49090
Multi-target exporter pattern (/probe)
MKTXP supports the Prometheus multi-target exporter pattern via the /probe endpoint. This allows using a module (a regular mktxp.conf entry) and optionally overriding the hostname with a target parameter for the scrape request.
The multi-target pattern is designed for large deployments and service discovery. To keep Grafana dashboard compatibility, use relabeling as described in the reference guide or in the provided example.
Reference: https://prometheus.io/docs/guides/multi-target-exporter/#the-multi-target-exporter-pattern
In the following example we override the username/password and disable POE collection while enabling routing stats. The entry is marked as probe-only with module_only = True.
[router-module]
    # for specific configuration on the router/module level, overload the defaults here
    module_only = True
    routing_stats = True
    poe = False
    username = some_user
    password = secret_password
Example of a multi-target Prometheus job:
  - job_name: 'mktxp-multi-target'
    metrics_path: /probe
    params:
      module: [router-module] # a regular mktxp.conf entry
    static_configs:
      - targets:
        - router01.example.com
        - router2
    relabel_configs:
      - source_labels: [__address__]
        target_label: __param_target
      - source_labels: [__param_target]
        target_label: instance
      - source_labels: [__param_target]
        target_label: routerboard_name # this replaces the label routerboard_name with the "target"
      - target_label: __address__
        replacement: mktxp_machine_IP:49090
Notes:
modulerefers to an mktxp.conf entry for the/probeendpoint; ifmodule_only = True, it will only work via/probeand requirestarget.targetis optional for non-module-only entries; when set, it overrides the module hostname for that request.
MKTXP system configuration
In case you need more control on how MKTXP is run, it can be done via editing the _mktxp.conf file. This allows things like changing the port 💡 and other impl-related parameters, enable parallel router fetching and configurable scrapes timeouts, etc.
As before, for local installation the editing can be done directly from mktxp:
mktxp edit -i
[MKTXP]
    listen = '0.0.0.0:49090'         # Space separated list of socket addresses to listen to, both IPV4 and IPV6
    socket_timeout = 2

    initial_delay_on_failure = 120
    max_delay_on_failure = 900
    delay_inc_div = 5

    bandwidth = False                   # Turns metrics bandwidth metrics collection on / off
    bandwidth_test_dns_server = 8.8.8.8 # The DNS server to be used for the bandwidth test connectivity check
    bandwidth_test_interval = 600       # Interval for collecting bandwidth metrics
    minimal_collect_interval = 5        # Minimal metric collection interval

    verbose_mode = False            # Set it on for troubleshooting

    fetch_routers_in_parallel = False   # Fetch metrics from multiple routers in parallel / sequentially
    max_worker_threads = 5              # Max number of worker threads that can fetch routers (parallel fetch only)
    max_scrape_duration = 10            # Max duration of individual routers' metrics collection (parallel fetch only)
    total_max_scrape_duration = 30      # Max overall duration of all metrics collection (parallel fetch only)

    persistent_router_connection_pool = True  # Use a persistent router connections pool between scrapes
    persistent_dhcp_cache = True              # Persist DHCP cache between metric collections
    compact_default_conf_values = False       # Compact mktxp.conf, so only specific values are kept on the individual routers' level
    prometheus_headers_deduplication = False  # Deduplicate Prometheus HELP / TYPE headers in the metrics output

    probe_connection_pool = False             # Enable probe-only connection reuse keyed by module+target
    probe_connection_pool_ttl = 300           # Probe connection TTL in seconds
    probe_connection_pool_max_size = 128      # Max number of probe connections to keep
💡 When changing the default mktxp port for docker image installs, you'll need to adjust the docker run ... -p 49090:49090 ... command to reflect the new port
Grafana dashboard
Now with your RouterOS metrics being exported to Prometheus, it's easy to visualize them with this Grafana dashboard
Description of CLI Commands
mktxp commands
   . MKTXP commands:
    .. info     Shows base MKTXP info
    .. edit     Open MKTXP configuration file in your editor of choice
    .. print    Displays selected metrics on the command line
    .. export   Starts collecting metrics for all enabled RouterOS configuration entries
    .. show     Shows MKTXP configuration entries on the command line
❯ mktxp -h
usage: MKTXP [-h] [--cfg-dir CFG_DIR] {info, edit, export, print, show, } ...

Prometheus Exporter for Mikrotik RouterOS

optional arguments:
  -h, --help            show this help message and exit
  --cfg-dir CFG_DIR     MKTXP config files directory (optional)
To learn more about individual commands, just run it with -h:
For example, to learn everything about mktxp show:
❯ mktxp show -h
usage: MKTXP show [-h]
                  [-en ['Sample-Router']]
                  [-cfg]
Displays MKTXP config router entries
optional arguments:
  -h, --help            show this help message and exit
  -en, --entry-name ['Sample-Router']
                        Config entry name
  -cfg, --config        Shows MKTXP config files paths
Advanced features
While most of the mktxp options are self explanatory, some might require a bit of a context.
Remote DHCP resolution
When gathering various IP address-related metrics, MKTXP automatically resolves IP addresses whenever DHCP info is available. In many cases however, the exported devices do not have this information locally and instead rely on central DHCP servers. To improve readability / usefulness of the exported metrics, MKTXP supports remote DHCP server calls via the following option:
remote_dhcp_entry = None # An MKTXP entry to provide for remote DHCP info / resolution
MKTXP entry in this context can be any other mktxp.conf entry, and for the sole purpose of providing DHCP info it does not even need to be enabled. An example:
[RouterA]
    ...  # RouterA settings as normal

[RouterB]
    remote_dhcp_entry = RouterA  # Will resolve via RouterA
Remote CAPsMAN info
Similar to remote DHCP resolution, mktxp allows collecting CAPsMAN-related metrics via the following option:
remote_capsman_entry = None # An MKTXP entry to provide for remote capsman info
MKTXP entry in this context can be any other mktxp.conf entry, and for the sole purpose of collecting CAPsMAN-related metrics it does not even need to be enabled. An example:
[RouterA]
    ...  # RouterA settings as normal

[RouterB]
    remote_capsman_entry = RouterA  # Will collect the CAPsMAN-related info via router A
Kid Control device monitoring
MKTXP Kid Control metrics help track network activity and bandwidth usage for all connected devices on a RouterOS network. This makes it easy to identify high-traffic devices and monitor network usage patterns in real-time.
The Kid Control functionality offers two modes of operation:
kid_control_assigned = False    # Allow Kid Control metrics for connected devices with assigned users
kid_control_dynamic = False     # Allow Kid Control metrics for all connected devices, including those without assigned user
When set up on the router, is is possible to view Kid Control device metrics directly from the command line:
❯ mktxp print -en MKT-GT -kc
MKT-GT@10.70.0.1: OK to connect
Connecting to router MKT-GT@10.70.0.1
2025-09-24 12:08:42 Connection to router MKT-GT@10.70.0.1 has been established
+-------------------+-------------------+---------------+----------------+-------------------+------------------+---------+-----------+------------+
|     dhcp_name     |       name        |     user      |  dhcp_address  |    mac_address    |    ip_address    | rate_up | rate_down | idle_time  |
+===================+===================+===============+================+===================+==================+=========+===========+============+
| MacBook Pro       |    MacBookPro     | alice         |   10.10.0.15   | A1:B2:C3:D4:E5:F6 |   10.10.0.15     | 2 Mbps  |  15 Mbps  |  a second  |
| Smart TV          |   Samsung TV      |               |   10.20.0.45   | C1:D2:E3:F4:A5:B6 |   10.20.0.45     | 1 Mbps  |  8 Mbps   | 10 seconds |
| iPhone 15         |     iPhone        | alice         |   10.10.0.22   | A2:B3:C4:D5:E6:F7 |   10.10.0.22     | 512 Kbps|  3 Mbps   |  2 seconds |
| Galaxy Tab        |  Samsung Galaxy   | bob           |   10.10.0.28   | B1:C2:D3:E4:F5:A6 |   10.10.0.28     | 256 Kbps|  1 Mbps   |  5 seconds |
| Kitchen Display   |   Google Nest     |               |   10.20.0.52   | D1:E2:F3:A4:B5:C6 |   10.20.0.52     | 128 Kbps|  512 Kbps | 30 seconds |
| Ring Doorbell     |   Ring Camera     |               |   10.20.0.67   | E1:F2:A3:B4:C5:D6 |   10.20.0.67     | 64 Kbps |  256 Kbps |  a minute  |
| Smart Thermostat  |      Nest         |               |   10.20.0.73   | F1:A2:B3:C4:D5:E6 |   10.20.0.73     | 32 Kbps |  64 Kbps  |  2 minutes |
| Alexa Echo        |   Amazon Echo     |               |   10.20.0.81   | A3:B4:C5:D6:E7:F8 |   10.20.0.81     |  0 bps  |   0 bps   |  5 minutes |
+-------------------+-------------------+---------------+----------------+-------------------+------------------+---------+-----------+------------+
alice devices: 2
bob devices: 1
User-assigned devices: 3
Dynamic devices (no user): 5
Total Kid Control devices: 8
The devices are automatically sorted by total bandwidth usage (upload + download rates), making it easy to identify high-traffic devices at a glance.
Address List device monitoring
Similarly to the above, MKTXP IPv4 / IPv6 firewall address lists can be inspected directly from the command line. The feature supports multiple address lists and automatically detects which IP versions contain which entries.
❯ mktxp print -en MKT-GT -al "blocklist, allowlist"
MKT-GT@10.70.0.1: OK to connect
Connecting to router MKT-GT@10.70.0.1
2025-09-25 12:15:30 Connection to router MKT-GT@10.70.0.1 has been established

Address Lists (IPv4):
+----------+---------------+------------------+---------+---------+----------+
|   list   |    address    |     comment      | timeout | dynamic | disabled |
+==========+===============+==================+=========+=========+==========+
| blocklist| 192.168.1.100 | Suspicious host  |         |   No    |   No     |
| blocklist| 10.0.0.5      | Auto-blocked     | 2h      |   Yes   |   No     |
| allowlist| 192.168.1.10  | Admin workstation|         |   No    |   No     |
+----------+---------------+------------------+---------+---------+----------+
Total entries: 3
Unique lists: 2

Address Lists (IPv6):
+----------+----------------+------------------+---------+---------+----------+
|   list   |    address     |     comment      | timeout | dynamic | disabled |
+==========+================+==================+=========+=========+==========+
| blocklist| 2001:db8::bad  | IPv6 bad actor   |         |   No    |   No     |
+----------+----------------+------------------+---------+---------+----------+
Total entries: 1
Unique lists: 1
The command automatically queries both IPv4 and IPv6 address lists, displaying separate tables when entries exist in both IP versions. Missing lists are reported as warnings, and entries are sorted by list name and then by address for easy scanning.
Connections stats
With many connected devices everywhere, one can often only guess where do they go to and what they actually do with all the information from your network environment. MKTXP let's you easily track those with a single option, with results available both from mktxp dashboard and the command line:
connection_stats = False        # Open IP connections metrics
connection_stats_destinations = False   # Set to True to track individual destination IPs/ports (Warning: High Cardinality)
Setting this to True obviously enables the feature and allows to see something like that:
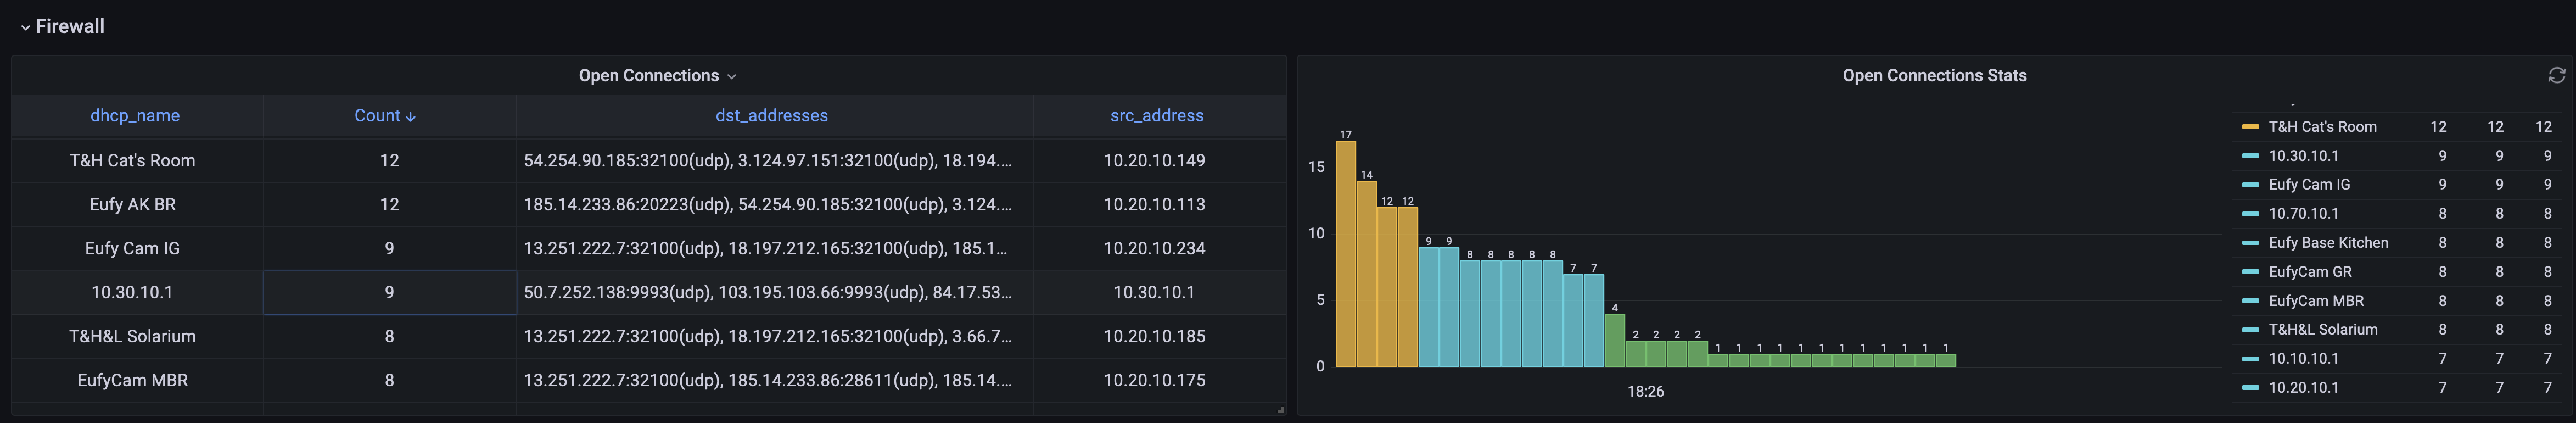
Hey, what is this Temp&Humidity sensor has to do with a bunch of open network connections? 12 of them, really? Let's go check on that in the dashboard, or just get the info right from the command line:
❯ mktxp print -en MKT-GT -cn
+-------------------+--------------+------------------+-----------------------------------------------------------------------+
|     dhcp_name     | src_address  | connection_count |                             dst_addresses                             |
+===================+==============+==================+=======================================================================+
| T&H Cat's Room    | 10.20.10.149 |        12        |          3.124.97.151:32100(udp), 13.38.179.104:32100(udp),           |
|                   |              |                  |                       54.254.90.185:32100(udp)
A few quick checks show all of the destination IPs relate to AWS instances, so supposedly it's legit... but let's remain vigilant, to know better :)
RouterBOARD inventory and firmware
RouterBOARD inventory and firmware status can be exported with:
routerboard = False # RouterBOARD inventory / firmware metrics
This enables:
mktxp_routerboard_infomktxp_routerboard_firmware_upgrade_available
The option is disabled by default. On devices without /system/routerboard support, enabling it may result in no data or scrape errors.
Parallel routers fetch
Concurrent exports across multiple devices can considerably speed up things for slow network connections. This feature can be turned on and configured with the following system options:
fetch_routers_in_parallel = False   # Set to True if you want to fetch multiple routers parallel
max_worker_threads = 5              # Max number of worker threads that can fetch routers (parallel fetch only)
max_scrape_duration = 10            # Max duration of individual routers' metrics collection (parallel fetch only)
total_max_scrape_duration = 30      # Max overall duration of all metrics collection (parallel fetch only)
To keeps things within expected boundaries, the last two parameters allows for controlling both individual and overall scrape durations
Injectable router-level custom labels
You can add custom labels to your devices using the custom_labels option. These labels are attached to all the metrics for a specific device, allowing e.g. easy router grouping for detailed overview dashboards in Grafana. You can define default labels in the [default] section and override or extend them in the router-specific sections.
mktxp endpoint listen addresses
By default, mktxp runs it's HTTP metrics endpoint on any IPv4 address on port 49090. However, it is also able to listen on multiple socket addresses, both IPv4 and IPv6.
You can configure this behaviour via the following system option, setting listen to a space-separated list of sockets to listen to, e.g.:
listen = '0.0.0.0:49090 [::1]:49090'
A wildcard for the hostname is supported as well, and binding to both IPv4/IPv6 as available.
Setting up MKTXP to run as a Linux Service
If you've installed MKTXP on a Linux system, you can run it with system boot via adding a service.
Let's start with:
❯ nano /etc/systemd/system/mktxp.service
Now copy and paste the following:
[Unit]
Description=MKTXP Exporter

[Service]
User=user # the user under which mktxp was installed
ExecStart=mktxp export # if mktxp is not at your $PATH, you might need to provide a full path

[Install]
WantedBy=default.target
Let's save and then start the service as well as check on its' status:
❯ sudo systemctl daemon-reload
❯ sudo systemctl start mktxp
❯ sudo systemctl enable mktxp

❯ systemctl status mktxp
● mktxp.service - MKTXP Mikrotik Exporter to Prometheus
     Loaded: loaded (/etc/systemd/system/mktxp.service; disabled; vendor preset: enabled)
     Active: active (running) since Sun 2021-01-24 09:16:44 CET; 2h 44min ago
     ...
Setting up MKTXP to run as a FreeBSD Service
If you've installed MKTXP on a FreeBSD system, you can run it with system boot via adding a service.
Let's start with:
❯ nano /usr/local/etc/rc.d/mktxp
Now copy and paste the following:
#!/bin/sh

# PROVIDE: mktxp
# REQUIRE: DAEMON NETWORKING
# BEFORE: LOGIN
# KEYWORD: shutdown

# Add the following lines to /etc/rc.conf to enable mktxp:
# mktxp_enable="YES"
#
# mktxp_enable (bool):    Set to YES to enable mktxp
#                Default: NO
# mktxp_user (str):       mktxp daemon user
#                Default: root

. /etc/rc.subr

name=mktxp
rcvar=mktxp_enable

: ${mktxp_enable:="NO"}
: ${mktxp_user:="root"}

# daemon
pidfile="/var/run/${name}.pid"
command="/usr/sbin/daemon"
mktxp_command="/usr/local/bin/mktxp export"
procname="daemon"
command_args=" -c -f -P ${pidfile} ${mktxp_command}"

load_rc_config $name
run_rc_command "$1"
Let's save and then start the service as well as check on its' status:
❯ sudo sysrc mktxp_enable="YES"
❯ service mktxp start
❯ service mktxp status

❯ service mktxp status
mktxp is running as pid 36704
Installing Development version
- Clone the repo, create a virtual environment, and activate it:
$ python3 -m venv .venv
$ source .venv/bin/activate
- Install the project in editable mode:
$ pip install -e .
Running Tests
- To run the test suite, first ensure you have installed the development dependencies:
$ pip install -e ".[test]"
- Then run the tests using
pytest:$ pytest -v --tb=short
(Note: If you have tox installed, you can still run $ tox for multi-environment testing)
Release history Release notifications | RSS feed


Download files
Download the file for your platform. If you're not sure which to choose, learn more about installing packages.
Source Distribution
Built Distribution
Filter files by name, interpreter, ABI, and platform.
If you're not sure about the file name format, learn more about wheel file names.
Copy a direct link to the current filters
File details
Details for the file mktxp-1.2.18.tar.gz.
File metadata
- Download URL: mktxp-1.2.18.tar.gz
- Upload date:
- Size: 103.1 kB
- Tags: Source
- Uploaded using Trusted Publishing? No
- Uploaded via: twine/6.2.0 CPython/3.14.6
File hashes
| Algorithm | Hash digest | |
|---|---|---|
| SHA256 |
dca94cfc11bb80309216e9ddffbae2efc49358b7857344dfb90737a64e585a96
|
|
| MD5 |
bc87d7f367fa14142cfffccc7ece7cda
|
|
| BLAKE2b-256 |
aa4ef3ffe2b60f0aeb646ff6b2dfa71c84c845abc3c77889ae513756260dd6b8
|
File details
Details for the file mktxp-1.2.18-py3-none-any.whl.
File metadata
- Download URL: mktxp-1.2.18-py3-none-any.whl
- Upload date:
- Size: 148.8 kB
- Tags: Python 3
- Uploaded using Trusted Publishing? No
- Uploaded via: twine/6.2.0 CPython/3.14.6
File hashes
| Algorithm | Hash digest | |
|---|---|---|
| SHA256 |
cb5ae6ff3276302419e43d81f15eafd4a5e09595f43b528db3b4e1fc915cf52b
|
|
| MD5 |
5a08f8ef077b1111d5b80110545e1625
|
|
| BLAKE2b-256 |
c6a21ccc9b2a2b5aeb5588608dbca55c2451ed506a3e135abfa3bf625b213263
|


