A Prometheus file based service discovery for Icinga2 and OP5 Monitor

Project description

monitor-promdiscovery
Overview
The monitor-promdiscovery tool generate file-based service discovery files for Prometheus, for the
monitor-exporter and icinga2-exporter.
The tool is typically run from cron or equivalent tool to check OP5 Monitor or Icinga2 for hosts service that should be
scraped for performance metrics by the exporters.
For a host to be detected, it must be a part of hostgroup(s) or servicegroup(s) that is defined in the configuration
file. For a servicegroup(s) configuration all hosts that has at least on service in the configured servicegroup(s) will
be added.
Servicegroups configuration is not supported for icinga2
Flow
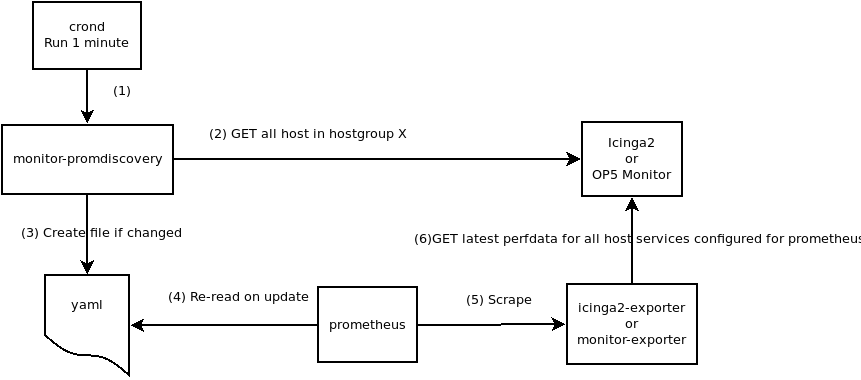
- monitor-promdiscovery is executed at regular intervals, e.g. every minute, by cron.
- monitor-promdiscovery performs a filter query against the configured Monitor instance for all hosts that are part of a specific hostgroup. All hosts in the hostgroup(s) will be scraped for all their services' performance data monitor-exporter or icinga2-exporter.
- monitor-promdiscovery checks against the configured file-based discovery if any host from the above call is new or not existing anymore.
- Only if there is not a match the file-based discovery file will be updated
- If the file is updated, Prometheus will reload the configuration file.
Running
Only use configuration file
python -m monitor_promdiscovery -f ./config.yml
Override system property in the configuration file
python -m monitor_promdiscovery -f ./config.yml -s <system>
Where can be either icinga2 or monitor
Installing
-
Check out / clone the git repo.
-
Install dependencies
pip install -r requirements.txt -
Build a distribution
python setup.py sdist -
Install locally
pip install dist/monitor-promdiscovery-X.Y.Z.tar.gz
Configuration
The monitor-promdiscovery configuration file should be rather self-explanatory.
NB! Only icinga2 or op5monitor has to be configured. If both are used, use the -s switch instead of configure system in the property file. Using the below config executing without specifiying -s , the icinga2 entry will be used.
# The system can be either op5monitor or icinga2
system: icinga2

op5monitor:
  url: https://monitor.local
  user: monitor
  passwd: monitor
  # Connection timeout - default 5
  # timeout: 5
  # Verify ssl - default False
  # verify: False

  # The hostgroup(s) used to select hosts as targets
  hostgroup:
    - prometheus
  # The servicegroup(s) used to select hosts as targets
  # Will include all hosts that has at least on service in the configured servicegroup(s)
  servicegroup:
    - servicepoint
  prometheus:
    # path where to create the file-based discovery file - must be set
    sd_file: <sd_directory>/monitor_sd.yml
    # Additional labels to tag metrics with - optional
    labels:
      source: monitor
      env: prod

icinga2:
  url: https://127.0.0.1:5665
  user: root
  passwd: cf593406ffcfd2ef
  # Connection timeout - default 5
  # timeout: 5
  # Verify ssl - default False
  # verify: False

  # The hostgroup used to select hosts as targets
  hostgroup:
    - prometheus
    - linux_servers
  prometheus:
    # path where to create the file-based discovery file - must be set
    sd_file: /home/andersh/programs/prometheus/sd/icinga2_sd.yml
    # Additional labels to tag metrics with - optional
    labels:
      source: icinga2
      env: prod

logger:
  # Path and name for the log file. If not set sent to stdout
  logfile: monitor-promdiscovery.log
  # Format if day will have current day as post fix
  # format: day
  # Log level
  #level: INFO
The hostgroup property can be both a single value or a list of different hostgroups as shown above.
Prometheus configuration
The Prometheus configuration file would typical have the following job configuration in the scrape_configs section for the monitor-exporter:
  - job_name: 'op5'
    scrape_interval: 2m
    metrics_path: /metrics
    file_sd_configs:
    - files:
      - 'sd/monitor_sd.yml'
    relabel_configs:
      - source_labels: [__address__]
        target_label: __param_target
      - source_labels: [__param_target]
        target_label: instance
      - target_label: __address__
        # The address for the monitor-exporter
        replacement: localhost:5000
And the format for icinga2 is almost the same:
  - job_name: 'icinga2'
    scrape_interval: 2m
    metrics_path: /metrics
    file_sd_configs:
    - files:
      - 'sd/icinga2_sd.yml'
    relabel_configs:
      - source_labels: [__address__]
        target_label: __param_target
      - source_labels: [__param_target]
        target_label: instance
      - target_label: __address__
        # The address for the monitor-exporter
        replacement: localhost:5000
The
file_sd_configsmust have the same filename as created by the tool, as defined in the configuration file.
System requirement
Python 3.6
For required packages, please review requirements.txt
Release history Release notifications | RSS feed


Download files
Download the file for your platform. If you're not sure which to choose, learn more about installing packages.
Source Distribution
Built Distribution
Filter files by name, interpreter, ABI, and platform.
If you're not sure about the file name format, learn more about wheel file names.
Copy a direct link to the current filters
File details
Details for the file monitor-promdiscovery-0.2.1.tar.gz.
File metadata
- Download URL: monitor-promdiscovery-0.2.1.tar.gz
- Upload date:
- Size: 33.7 kB
- Tags: Source
- Uploaded using Trusted Publishing? No
- Uploaded via: twine/4.0.2 CPython/3.11.7
File hashes
| Algorithm | Hash digest | |
|---|---|---|
| SHA256 |
94d72a6e10489349d15d1f1a01c7af9b809ff609fb1b411df4fac2c28b361f5e
|
|
| MD5 |
517a0672151145eb1eb12858e1368938
|
|
| BLAKE2b-256 |
c06f61666b1b9c94b66effbd325ddfa57957b53e380ea859f5e86ce9c2dcd73b
|
File details
Details for the file monitor_promdiscovery-0.2.1-py3-none-any.whl.
File metadata
- Download URL: monitor_promdiscovery-0.2.1-py3-none-any.whl
- Upload date:
- Size: 38.7 kB
- Tags: Python 3
- Uploaded using Trusted Publishing? No
- Uploaded via: twine/4.0.2 CPython/3.11.7
File hashes
| Algorithm | Hash digest | |
|---|---|---|
| SHA256 |
eace8d9b6506ba4ae42fdbe207dbdca1e702faef28f9d2487e061631cde56cb3
|
|
| MD5 |
d55845101caf3a2b693a2fcaec4c46c9
|
|
| BLAKE2b-256 |
58d6ef594559e0d2277efa548669b766a71888554d615a090ed5c18ba23be260
|


