interactive data markers for matplotlib

Project description
mpl-markers
Interactive data markers for matplotlib.
Installation
pip install mpl-markers
Usage
import mpl_markers as mplm
Line Markers
Add a marker attached to matplotlib data lines:
import numpy as np
import matplotlib.pyplot as plt

fig, ax = plt.subplots(1,1)
x1 = np.linspace(-np.pi, np.pi, 1000)

ax.plot(x1, np.sin(x1)*np.cos(x1)**2)
# create line marker at x=0.
mplm.line_marker(x=0)
In interactive matplotlib backends (i.e. Qt5Agg), the marker can be dragged to any location along the data line, or moved incrementally with the left/right arrow keys.
The following keyboard shortcuts are supported in interactive mode, (note that the mouse must be inside the axes to register a keyboard event)
| Action | Keyboard Shortcut |
|---|---|
| Add marker | Shift + Left Mouse |
| Remove active marker | Delete |
| Redraw figure | F5 |
| Shift active marker right | Right Arrow |
| Shift active marker left | Left Arrow |
| Shift active marker right (10 steps) | Shift + Right Arrow |
| Shift active marker left (10 steps) | Shift + Left Arrow |
When moving markers interactively, the labels of the active marker may overlap with other markers on the axes. To stack overlapping markers, redraw the figure with F5.
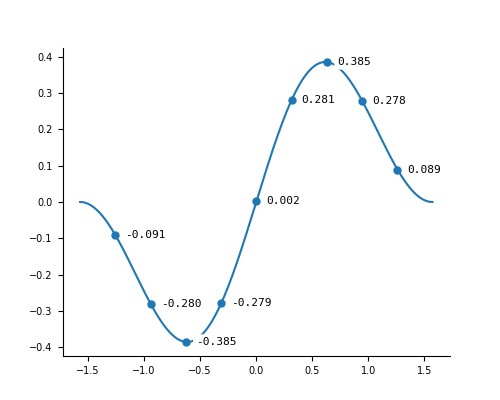
Markers can be placed by x position, x/y position, or by the line data index. If index value(s) are given, they will override the x/y arguments if they are given.
# turn the label outline off, and use a rounded box style instead of the default square
mplm.set_style(
    ylabel=dict(fontfamily="monospace", bbox=dict(linewidth=0, facecolor="white", boxstyle="round4"))
)

fig, ax = plt.subplots(1,1)
x1 = np.linspace(-np.pi/2, np.pi/2, 1000)
ax.plot(x1, np.sin(x1) * np.cos(x1)**2)

# place markers every 100 points
mplm.line_marker(idx = np.arange(100, 1000, 100))
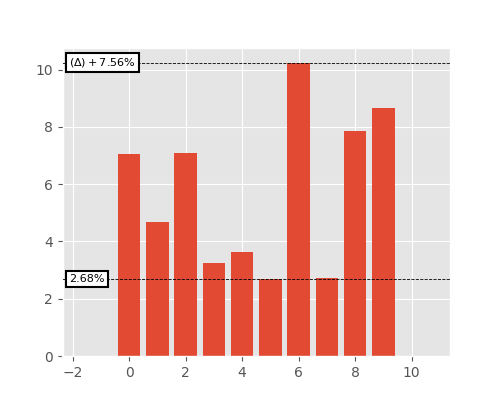
Axis Markers
Axis markers move freely on the canvas and are not attached to data lines. Axis markers can reference other markers to create a delta marker.
fig, ax = plt.subplots(1, 1)
y1 = np.random.normal(6, 3, size=10)

ax.bar(np.arange(10), y1)
ax.margins(x=0.2)

# create horizontal axis marker
m1 = mplm.axis_marker(y=np.min(y1), yformatter="{:.2f}%")

# create second marker that is referenced from the first marker m1
mplm.axis_marker(y=np.max(y1), ref_marker=m1, yformatter="{:.2f}%")
Meshgrid Markers
Data markers can also be added to pcolormesh plots. The marker label shows the value of the color-mapped z data.
xy = np.linspace(-1, 1, 100)
x, y = np.meshgrid(xy, xy)
z = np.sin(2*x)**2 + np.cos(3*y)**2

fig, ax = plt.subplots(1, 1)
m = ax.pcolormesh(x, y, z, vmin=0, vmax=2)
plt.colorbar(m)

# add a data marker at a single x/y point on the plot. x/y is in data coordinates.
mplm.mesh_marker(x=0.75, y=0)

Scatter Plot Marker
Markers attached to scatter plots can be added with scatter_marker.
data_x = np.random.normal(-1, 1, 100)
data_y = np.random.normal(-1, 1, 100)

fig, ax = plt.subplots(1, 1)
s = ax.scatter(data_x, data_y, color="b")

# place the marker on the point closest to x=0.5, y=0.5.
mplm.scatter_marker(
    x=0.5,
    y=0.5,
    yformatter=lambda x, y, pos: f"x={x:.2f}\ny={y:.2f}",
    scatterdot=dict(color="cyan", markeredgecolor="cyan"), # change the color of the active point
    anchor="upper left",
)

Markers in Jupyter Notebooks
Markers are non-interactive in juypter notebooks with the default matplotlib backend. To enable interactive markers, first install the ipympl backend,
pip install ipympl
Then enable the backend in jupyter with,
matplotlib.use("ipympl")
This backend is still experimental with mpl-markers, expect a few issues when using it. It does not support blitting (the image is entirely redrawn and exported as a png on each draw event), so there is some lag when dragging markers.
See this notebook for a full example.
Styling
The marker style is controlled by the mpl_markers/style/default.json file:
{
    "xline": {
        "linewidth": 0.6,
        "color": "k",
        "linestyle": "dashed"
    },
    "yline": {
        "linewidth": 0.6,
        "color": "k",
        "linestyle": "dashed"
    },
    "xlabel": {
        "fontsize": 8,
        "color": "black",
        "padding": 5,
        "bbox": {
            "boxstyle": "square",
            "facecolor": "white",
            "edgecolor": "black",
            "alpha": 1,
            "linewidth": 1.5
        }
    },
    "ylabel": {
        "fontsize": 8,
        "padding": 5,
        "offset": 10,
        "bbox": {
            "boxstyle": "square",
            "facecolor": "white",
            "edgecolor": "black",
            "alpha": 1,
            "linewidth": 1.5
        }
    },
    "zlabel": {
        "fontsize": 8,
        "padding": 10,
        "bbox": {
            "boxstyle": "square",
            "facecolor": "white",
            "edgecolor": "black",
            "alpha": 1,
            "linewidth": 1.5
        }
    },
    "datadot": {
        "markersize": 10,
        "marker": "."
    },
    "axisdot": {
        "markersize": 10,
        "marker": ".",
        "markerfacecolor":"white",
        "markeredgecolor":"k"
    },
    "scatterdot": {
        "markersize": 10,
        "marker": ".",
        "markeredgewidth": 1,
        "markeredgecolor": "white"
    }
}
To use custom styles, pass in a dictionary of artist settings to the set_style method. Keys that do not match those found in default.json are ignored. Settings are applied globally to all future markers.
mplm.set_style(
    ylabel=dict(fontfamily="monospace", bbox=dict(linewidth=0, facecolor="none"))
)
To limit the style scope to a specific axes, artist settings can also be passed into init_axes as kwargs. Settings can also be passed to individual markers when they are created, and allows for mixed styles on the same axes.
# Inherits global settings from the last set_style call.
mplm.line_marker(
    x=np.pi/4,
    ylabel=dict(fontsize=11),
    xline=False # turn off the xline artist
)

Custom .json files are supported with the mplm.set_style_json method. This will set the style on all future markers and must have the same keys as the default.json file:
mplm.set_style_json("user_style.json")
License
mpl-markers is licensed under the MIT License.
Release history Release notifications | RSS feed


Download files
Download the file for your platform. If you're not sure which to choose, learn more about installing packages.
Source Distribution
Built Distribution
Filter files by name, interpreter, ABI, and platform.
If you're not sure about the file name format, learn more about wheel file names.
Copy a direct link to the current filters
File details
Details for the file mpl_markers-0.0.21.tar.gz.
File metadata
- Download URL: mpl_markers-0.0.21.tar.gz
- Upload date:
- Size: 31.0 kB
- Tags: Source
- Uploaded using Trusted Publishing? No
- Uploaded via: twine/6.1.0 CPython/3.12.3
File hashes
| Algorithm | Hash digest | |
|---|---|---|
| SHA256 |
9df325363a5b67eef63f09b7109d37b287a6e2c1aea8ef6df2875644f9bf3564
|
|
| MD5 |
a3ff1ace462617084b580f8dec628bbb
|
|
| BLAKE2b-256 |
c6bae5df508413183e652d2f87dc6f4a868c4c6fd12a2db78b61bc98d4f8f656
|
File details
Details for the file mpl_markers-0.0.21-py3-none-any.whl.
File metadata
- Download URL: mpl_markers-0.0.21-py3-none-any.whl
- Upload date:
- Size: 25.8 kB
- Tags: Python 3
- Uploaded using Trusted Publishing? No
- Uploaded via: twine/6.1.0 CPython/3.12.3
File hashes
| Algorithm | Hash digest | |
|---|---|---|
| SHA256 |
759d871d53f331f46dcd7f6b14768b24e6d9dfe6447db359ca006cf8b3a46101
|
|
| MD5 |
634daacf998cc44bba070f707fd3e687
|
|
| BLAKE2b-256 |
8e09fd94b3c225489a679a4f472ab91133650a6ff6b4e9b8c66c18d4aeb74a7f
|


