
MyGrADS


This is a collection of functions implemented in python that replicate their implementation in GrADS.
Requires Numpy for the calculations. We use Xarray to read in the nc files, Matplotlib and Cartopy for plotting. Below there is a simple example to be ran with the sample data included in the package.
Installation
pip install mygrads
Example
Import
import mygrads as mg
Other usual imports
import numpy as np
import xarray as xr
import cartopy.crs as ccrs
import matplotlib.pyplot as plt
Read in some data
# We are using some sample data downloaded from the NCEP Reanalysis 2
# Downloaded from: https://www.esrl.noaa.gov/psd/data/gridded/data.ncep.reanalysis2.html

# Zonal wind
ds   = xr.open_dataset('data/u.nc')
u    = ds['uwnd'][0,0,:,:].values
lat  = ds['lat'].values
lon  = ds['lon'].values

# Meridional wind
ds   = xr.open_dataset('data/v.nc')
v    = ds['vwnd'][0,0,:,:].values

# Temperature
ds   = xr.open_dataset('data/t.nc')
t    = ds['air'][0,0,:,:].values
Examples
Horizontal Divergence
Identical as GrADS hdivg (ref.).
div = mg.hdivg(u,v,lat,lon)
Relative Vorticity
Or the vertical component of the relative vorticity. Identical as GrADS hcurl (ref.)
vort = mg.hcurl(u,v,lat,lon)
Temperature Advection
This is not natively implemented in GrADS. Nonthenless, it is pretty straightforward given the above functions, and already described here.
tadv = mg.hadv(u,v,t,lat,lon)
Centered Finite Differences
This replicates the cdiff function of GrADS (see their docu. "The difference is done in the grid space, and no adjustment is performed for unequally spaced grids. The result value at each grid point is the value at the grid point plus one minus the value at the grid point minus one."
It is also used internally here in hdivg, hcurl and hadv implementatinos. The numpy-like argument axis should be 0 or 1, to indicate the dimension over which the derivative is being calculated.
latv, lonv = np.meshgrid(lat, lon, indexing='ij')
dudx = mg.cdiff(u, axis=0)/mg.cdiff(lonv*np.pi/180)
Plot
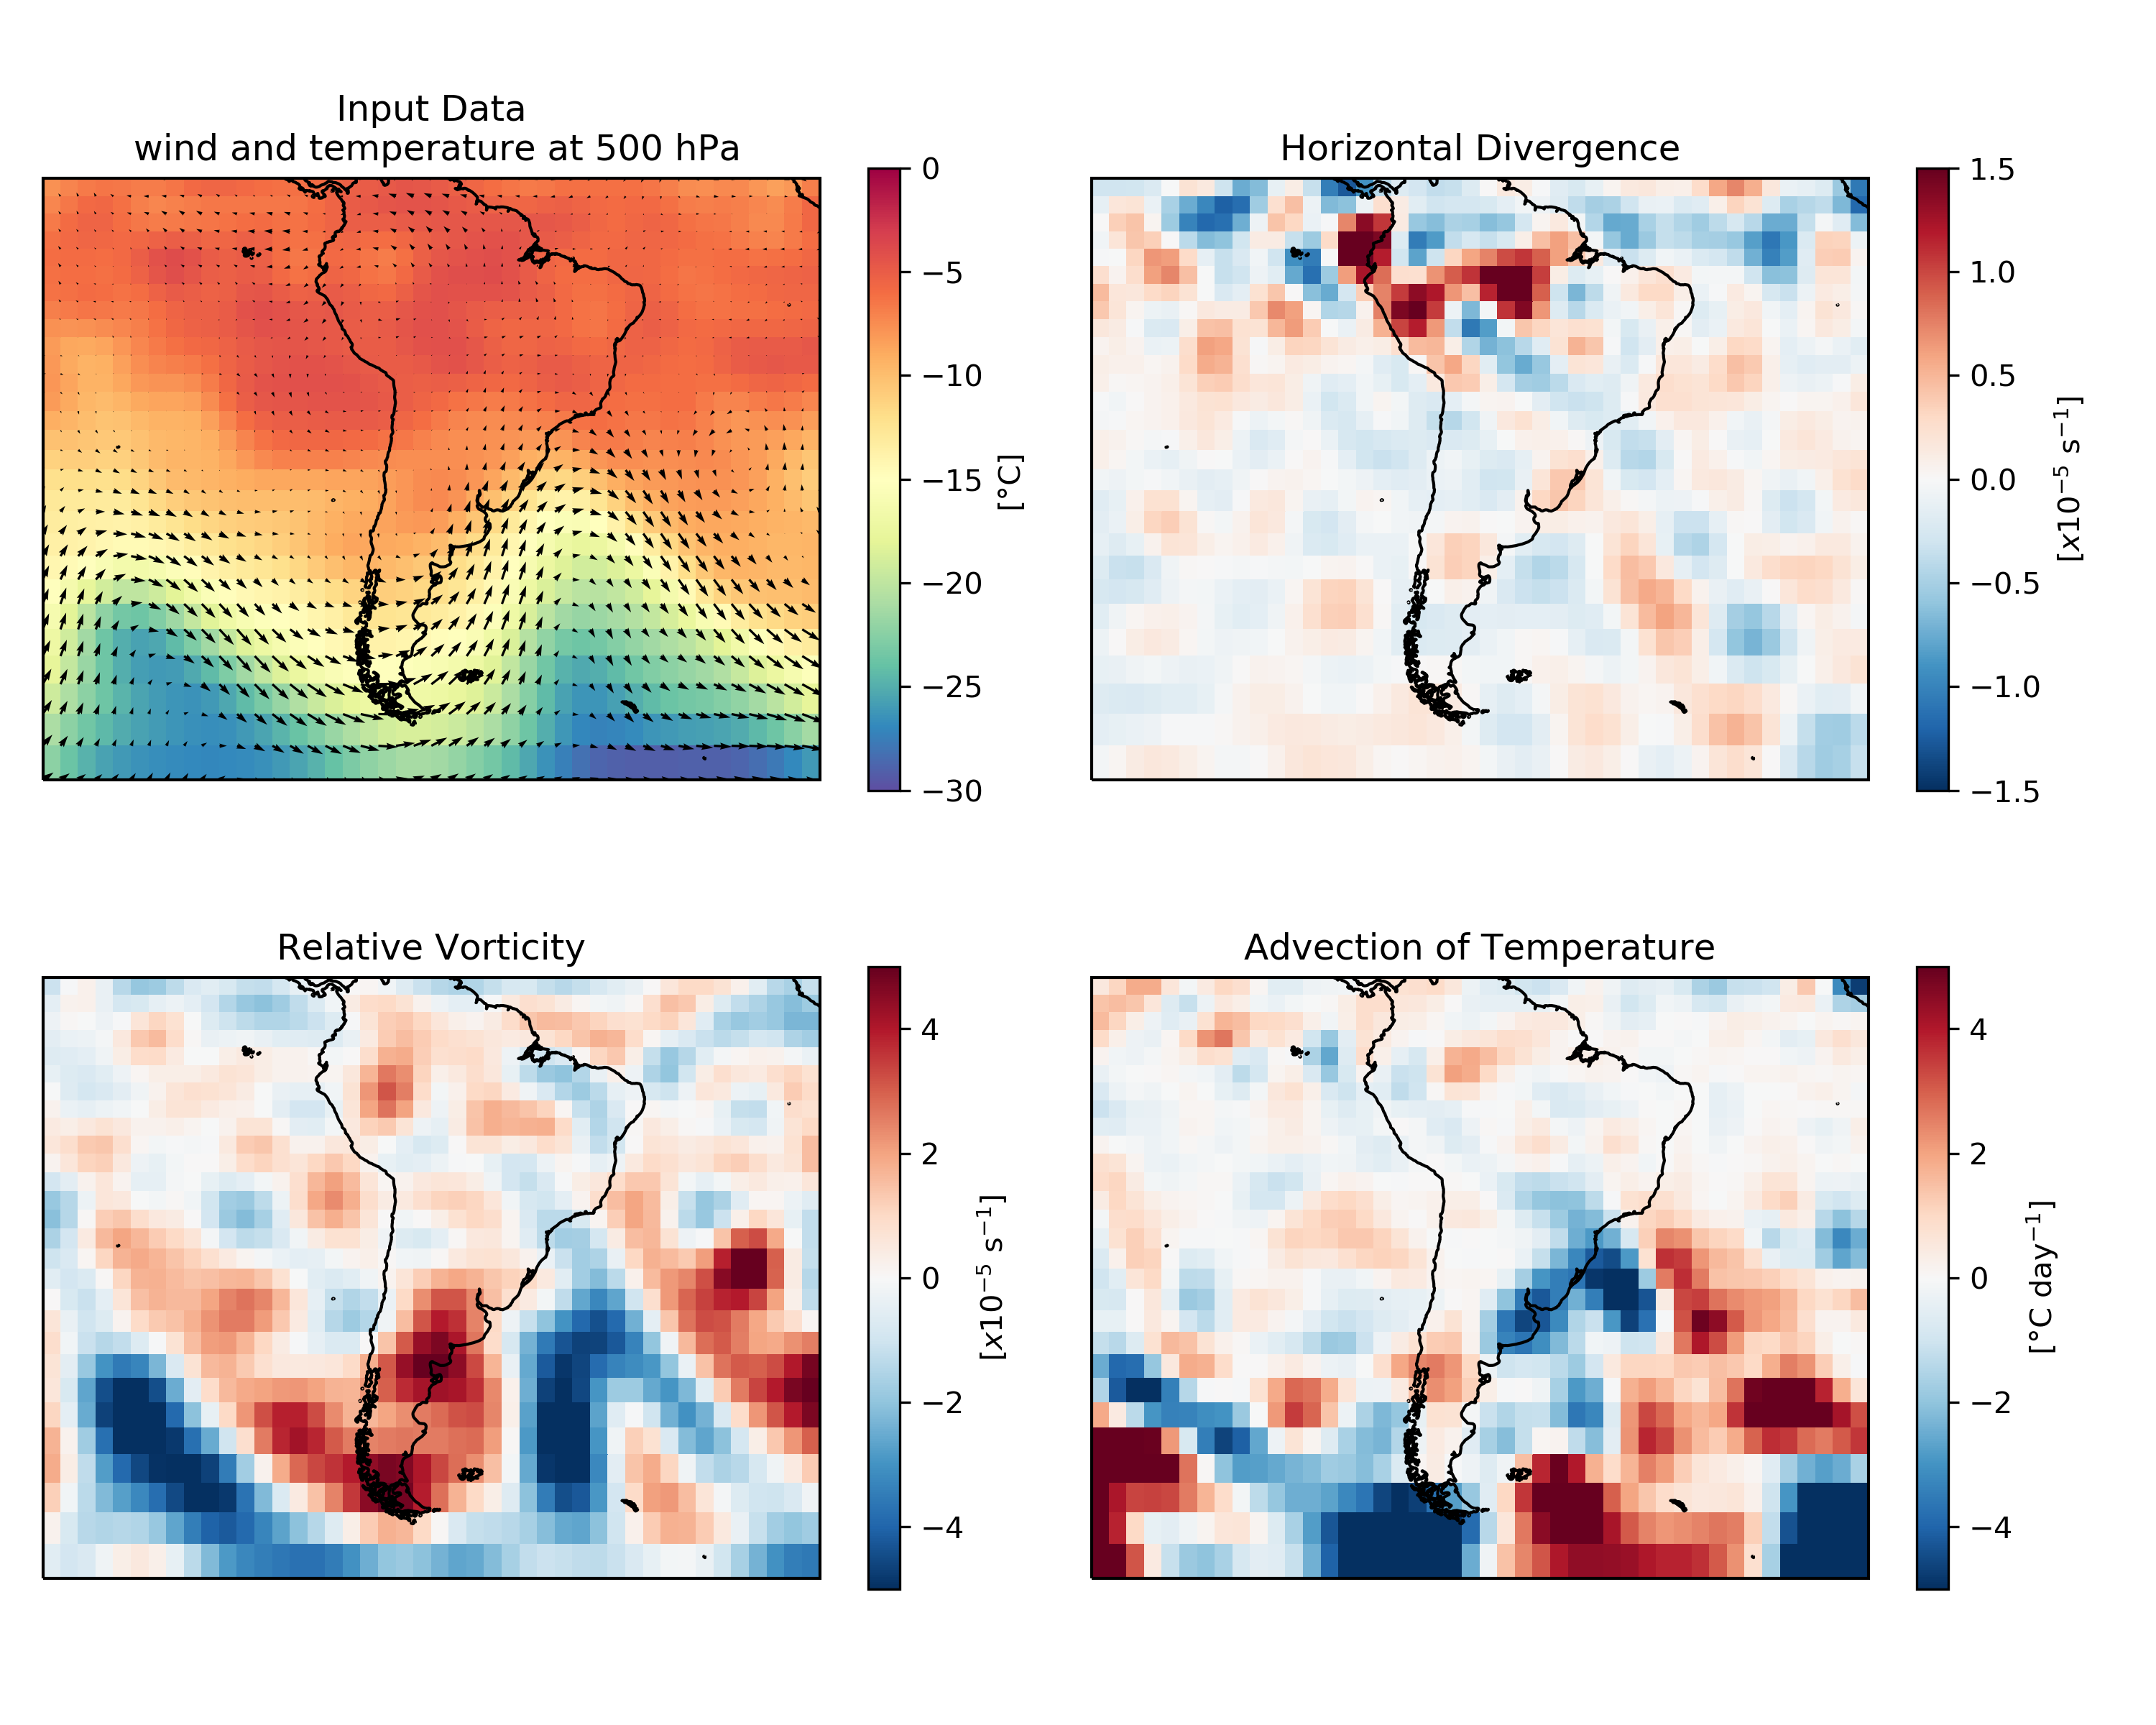
Note that the data are from thr 500 hPa level, so the wind is basically geostrophic. Therefore, not much divergece results in the vicinities of the jet.
fig = plt.figure(figsize=(10, 8))

ax = fig.add_subplot(2,2,1,projection=ccrs.Mercator())
ax.set_extent([-120, -10, -60, 10], crs=ccrs.PlateCarree())
ax.coastlines(resolution='50m')
mesh = ax.pcolormesh(lon, lat,t-273.5, vmin=-30,vmax=0, transform=ccrs.PlateCarree(), cmap="Spectral_r")
cbar=plt.colorbar(mesh, shrink=0.75,label='[°C]')
q = ax.quiver(lon, lat, u, v, minlength=0.1, scale_units='xy',scale=0.0001, transform=ccrs.PlateCarree(), color='k',width=0.003)
plt.title('Input Data\n wind and temperature at 500 hPa')

ax = fig.add_subplot(2,2,2,projection=ccrs.Mercator())
ax.set_extent([-120, -10, -60, 10], crs=ccrs.PlateCarree())
ax.coastlines(resolution='50m')
mesh = ax.pcolormesh(lon, lat, div*100000, vmin=-1.5,vmax=1.5, transform=ccrs.PlateCarree(), cmap="RdBu_r")
cbar=plt.colorbar(mesh, shrink=0.75,label='[$x10^{-5}$ s$^{-1}$]')
plt.title('Horizontal Divergence')

ax = fig.add_subplot(2,2,3,projection=ccrs.Mercator())
ax.set_extent([-120, -10, -60, 10], crs=ccrs.PlateCarree())
ax.coastlines(resolution='50m')
mesh = ax.pcolormesh(lon, lat, vort*100000, vmin=-5,vmax=5, transform=ccrs.PlateCarree(), cmap="RdBu_r")
cbar=plt.colorbar(mesh, shrink=0.75,label='[$x10^{-5}$ s$^{-1}$]')
plt.title('Relative Vorticity')

ax = fig.add_subplot(2,2,4,projection=ccrs.Mercator())
ax.set_extent([-120, -10, -60, 10], crs=ccrs.PlateCarree())
ax.coastlines(resolution='50m')
mesh = ax.pcolormesh(lon, lat, tadv*84600, vmin=-5,vmax=5, transform=ccrs.PlateCarree(), cmap="RdBu_r")
cbar=plt.colorbar(mesh, shrink=0.75,label='[°C day$^{-1}$]')
plt.title('Advection of Temperature')

plt.tight_layout()
fig.savefig('example.png', dpi=300)
1 maintainer

Metadata
1 maintainer
Release files for mygrads 0.0.3
For a detailed explanation of source distributions (sdists) and built distributions (wheels), please see the package formats documentation.
Source distribution (sdist)
| File | Size | Uploaded | |
|---|---|---|---|
| mygrads-0.0.3.tar.gz | 750.1 kB | Details |
Built distribution (wheel)
| File | Interpreter | ABI | Platform | Reset |
|---|---|---|---|---|
| mygrads-0.0.3-py3-none-any.whl | Python 3 | none | any | Details |
Total release size: 755.1 kB
Release files / mygrads-0.0.3.tar.gz
| Download URL | mygrads-0.0.3.tar.gz |
|---|---|
| Size | 750.1 kB |
| Tags | Source |
|
SHA-256 checksum How to use checksums |
7cecc29c18ae82f021966836db51df98808b25339101f412d576e04137828f82
|
|
BLAKE2b-256 checksum How to use checksums |
f0034e7ec9bc52da405b3be5fc270164fe6285f0a7aa90c500c8d6daaa2949cc
|
| Upload date | |
|
Uploaded using Trusted Publishing? What is trusted publishing? |
No |
| Uploaded via |
twine/1.13.0 pkginfo/1.5.0.1 requests/2.21.0 setuptools/41.0.1 requests-toolbelt/0.9.1 tqdm/4.31.1 CPython/3.7.2
|
Release files / mygrads-0.0.3-py3-none-any.whl
| Download URL | mygrads-0.0.3-py3-none-any.whl |
|---|---|
| Size | 5.0 kB |
| Tags | Python 3 |
|
SHA-256 checksum How to use checksums |
5f64e71ff4da861070245ed6e8bbd0937fe6e701982d0c45a6fbb3466ebc05d1
|
|
BLAKE2b-256 checksum How to use checksums |
dd1c5970b1dc4006c5840e371bb45bb52fa10c10a5252e06ac6203db29e2ff64
|
| Upload date | |
|
Uploaded using Trusted Publishing? What is trusted publishing? |
No |
| Uploaded via |
twine/1.13.0 pkginfo/1.5.0.1 requests/2.21.0 setuptools/41.0.1 requests-toolbelt/0.9.1 tqdm/4.31.1 CPython/3.7.2
|














