Python Library to Generate Nakamoto Coefficient

Project description
 Nakamoto: A Python Library for Quantifying Decentralization
A Python library for measuring the Nakamoto Coefficient of a Sector. Based on the post "Quantifying Dectralization"
Features:
- Nakamoto Coefficient Measurement
- Gini Coefficient Measurement
- Lorenz Curve Plot on Plotly
- Decentralization Plot (Lorenz + Nakamoto Features)
- Custom + Built In Sectors (See Sectors section)
Installation Instructions
$ pip install nakamoto
Running Tests
Make sure to sign up for Plotly to get an API Key, as well as get a Github API Key. Github and Market URL Environment Variables aren't required to run full test script below.
PLOT_NOTEBOOK=1 PLOT_IMAGE_PATH=image.png GITHUB_URL=Z python3 test.py
Sectors
We need to specify if we want to run this in a Jupyter Notebook or save the plot images. We can save the config in a dictionary like this:
nakamoto_config = {
    'plot_notebook': TRUE,
    'plot_image_path': "image.png"
}
where PLOT_NOTEBOOK and PLOT_IMAGE_PATH are the values you ge.
Custom Sectors
This module allows passing a numpy array of data to be processed in order to measure inequality distribution (gini) and decentralization
(nakamoto coefficient). We use CustomSector for that.
We can generate sample data for our gini and lorenz curve via the following command, which appends 2 Poisson random samples to
get a skewed dataset. We will also name a currency here, which we will use ETC for.:
random_data = np.append(np.random.poisson(lam=10, size=40),
                 np.random.poisson(lam=100, size=10))

currency = 'ETC'
Now, we will generate the CustomSector object using those variables:
from nakamoto.sector import CustomSector

custom_sector = CustomSector(random_data,
                 currency,
                 'custom_sector_type',
                 **nakamoto_config)
where 'custom_sector_type' is a string describing the sector type. For example, if the data I'm passing into the CustomSector
class is about mining rewards, I can just call the type mining_rewards.
To first get the Gini coefficient, we run the following command:
gini = custom_sector.get_gini_coefficient()
print(gini)
$ 0.5093952180028129535951653520
To get the Nakamoto coefficient, we run the following command:
nakamoto = custom_sector.get_nakamoto_coefficient()
print(nakamoto)
$ 7
To generate the Plotly graph and get the URL for the graph, we run this command:
plot = custom_sector.get_plot()
Repository
Measures Github contributions of all who contribute to a specific repository and determines how decentralized the repository is and the minimum number of developers needed to compromise it.
In order to get started, you first need to get a "Github API Key".
You also need to find a github repository url that you want to analyze for decentralization.
In this example, I'll be using IOHK's "Mantis Client" for Ethereum Classic.
from nakamoto.sector import Repository

github_url = "https://github.com/input-output-hk/mantis"
github_api = YOUR_GITHUB_API
repository = Repository(currency, github_api, github_url, **nakamoto_config)
Repository class will automatically analyze the github url data for you, so you can just call then .get_nakamoto_coefficient()
& .get_gini_coefficient() on repository. It also supports .get_plot_url() like CustomSector.
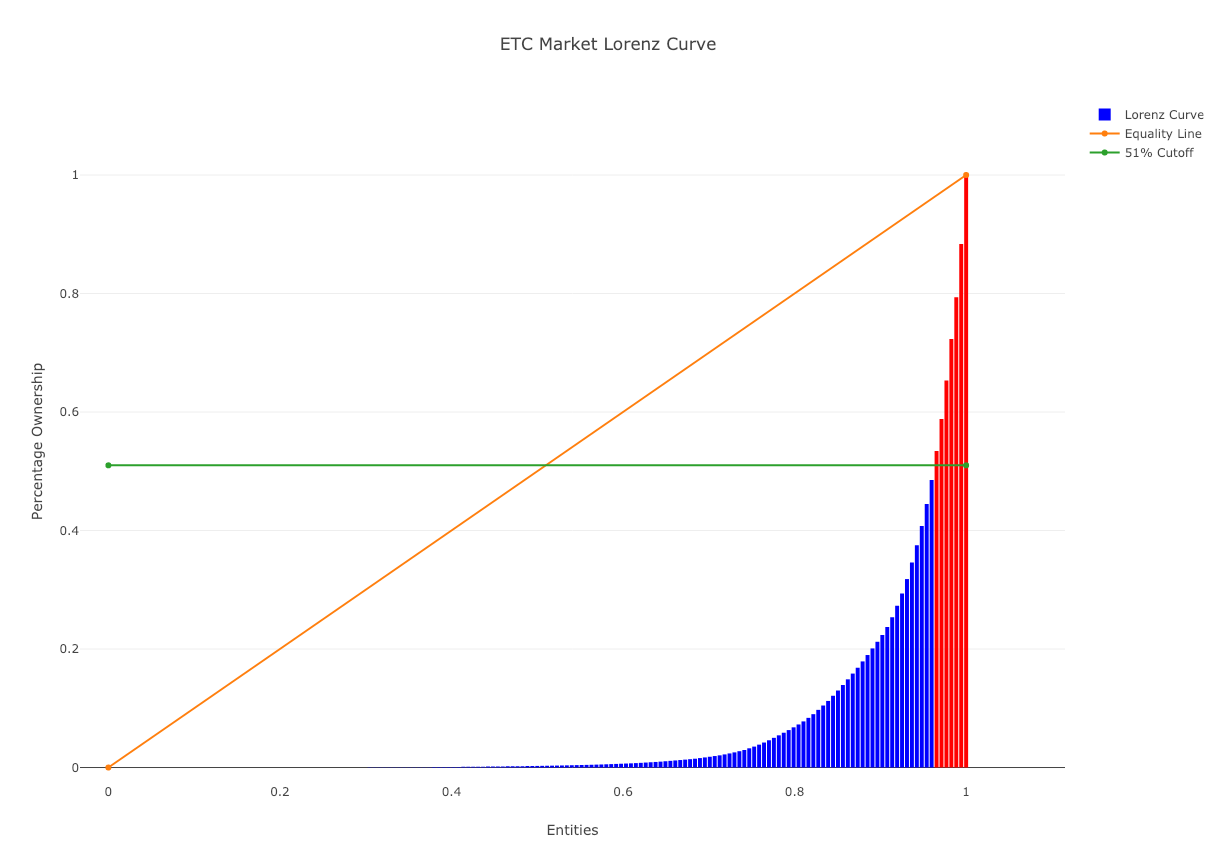
Market
Measures volume by cryptocurrency exchange using data from CoinMarketCap for a specific currency. Measures how centralized exchanges are in respect to a particular volume of a cryptocurrency and minimum exchanges needed to centralize volume.
Note: You need the #market link for your currency for CoinMarketCap. In this example, I use the Ethereum Classic Market URL:
from nakamoto.sector import Market

market_url = 'https://coinmarketcap.com/currencies/ethereum-classic/#markets'
market = Market(currency, market_url, **nakamoto_config)
Same methods to generate Gini, Nakamoto, and Lorenz Curve like CustomSector.
Client
Measures decentralization by client usage. Currently scrapes data for combined EVM nodes. Future versions aim to separate the data
and have more coins. For now, only 2 currencies you can pass it are ETC and ETH. It only calculates combined EVM nodes.
Future versions will have a separation between EVM chains and will include BTC. Pull Requests welcome!
from nakamoto.sector import Client

client = Client(currency, **nakamoto_config)
Same methods to generate Gini, Nakamoto, and Lorenz Curve like CustomSector.
Geography
Measures miner decentralization by country. Sames as Client, measures for combined EVM nodes. Future versions aim to separate
the data and have more coins. For now, only 2 currencies you can pass it are ETC and ETH. It only calculates combined EVM nodes.
Future versions will have a separation between EVM chains and will include BTC. Pull Requests welcome!
from nakamoto.sector import Geography

geography = Geography(currency, **nakamoto_config)
Same methods to generate Gini, Nakamoto, and Lorenz Curve like CustomSector.
Nakamoto Coefficient Class
The Nakamoto class can take in a list of sectors that you created above and can generate an analysis
over the entire ecosystem.
It returns back 2 things:
- Minimum Nakamoto: This is the minimum nakamoto of each sector's nakamoto, highlighting the most vulnerable sector as measured by the number of entities needed to compromise it.
- Maximum Gini: This shows the highest gini coefficient, indicating the sector with the highest distribution of inequality, indicating a centralization point.
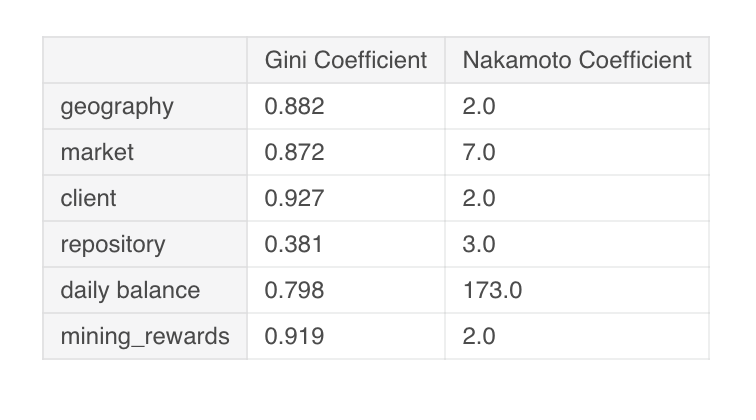
You can also generate a nice dataframe summary of all the sectors.
from nakamoto.coefficient import Nakamoto


sector_list = [geography,
               market,
               client,
               repository,
               custom_sector]
nakamoto = Nakamoto(sector_list)
Now, let's get the maximum gini and accompanying sector id
nakamoto.get_maximum_gini()
To get the minimum nakamoto coefficient, we execute the .get_minimum_nakamoto() method.
nakamoto.get_minimum_nakamoto()
In order to get a Pandas dataframe summary, use the .summary() method.
nakamoto.get_summary()
Release history Release notifications | RSS feed


Download files
Download the file for your platform. If you're not sure which to choose, learn more about installing packages.
Source Distribution
File details
Details for the file nakamoto-0.1.4.1.tar.gz.
File metadata
- Download URL: nakamoto-0.1.4.1.tar.gz
- Upload date:
- Size: 10.3 kB
- Tags: Source
- Uploaded using Trusted Publishing? No
- Uploaded via: twine/1.12.1 pkginfo/1.5.0.1 requests/2.19.1 setuptools/40.0.0 requests-toolbelt/0.8.0 tqdm/4.29.1 CPython/3.7.0
File hashes
| Algorithm | Hash digest | |
|---|---|---|
| SHA256 |
6ac4b385ac847e0abd4c545a9fb7f60a072a40a122bd6bfef328dbfff3aff3b7
|
|
| MD5 |
3ceaca3ffae311015f90acb2d333bcce
|
|
| BLAKE2b-256 |
93b687f4d96ccd65430336523b206eb49a723536d21b8352ee7f62cce1943891
|


