Plot intensity along a line in napari
Project description
napari-plot-profile
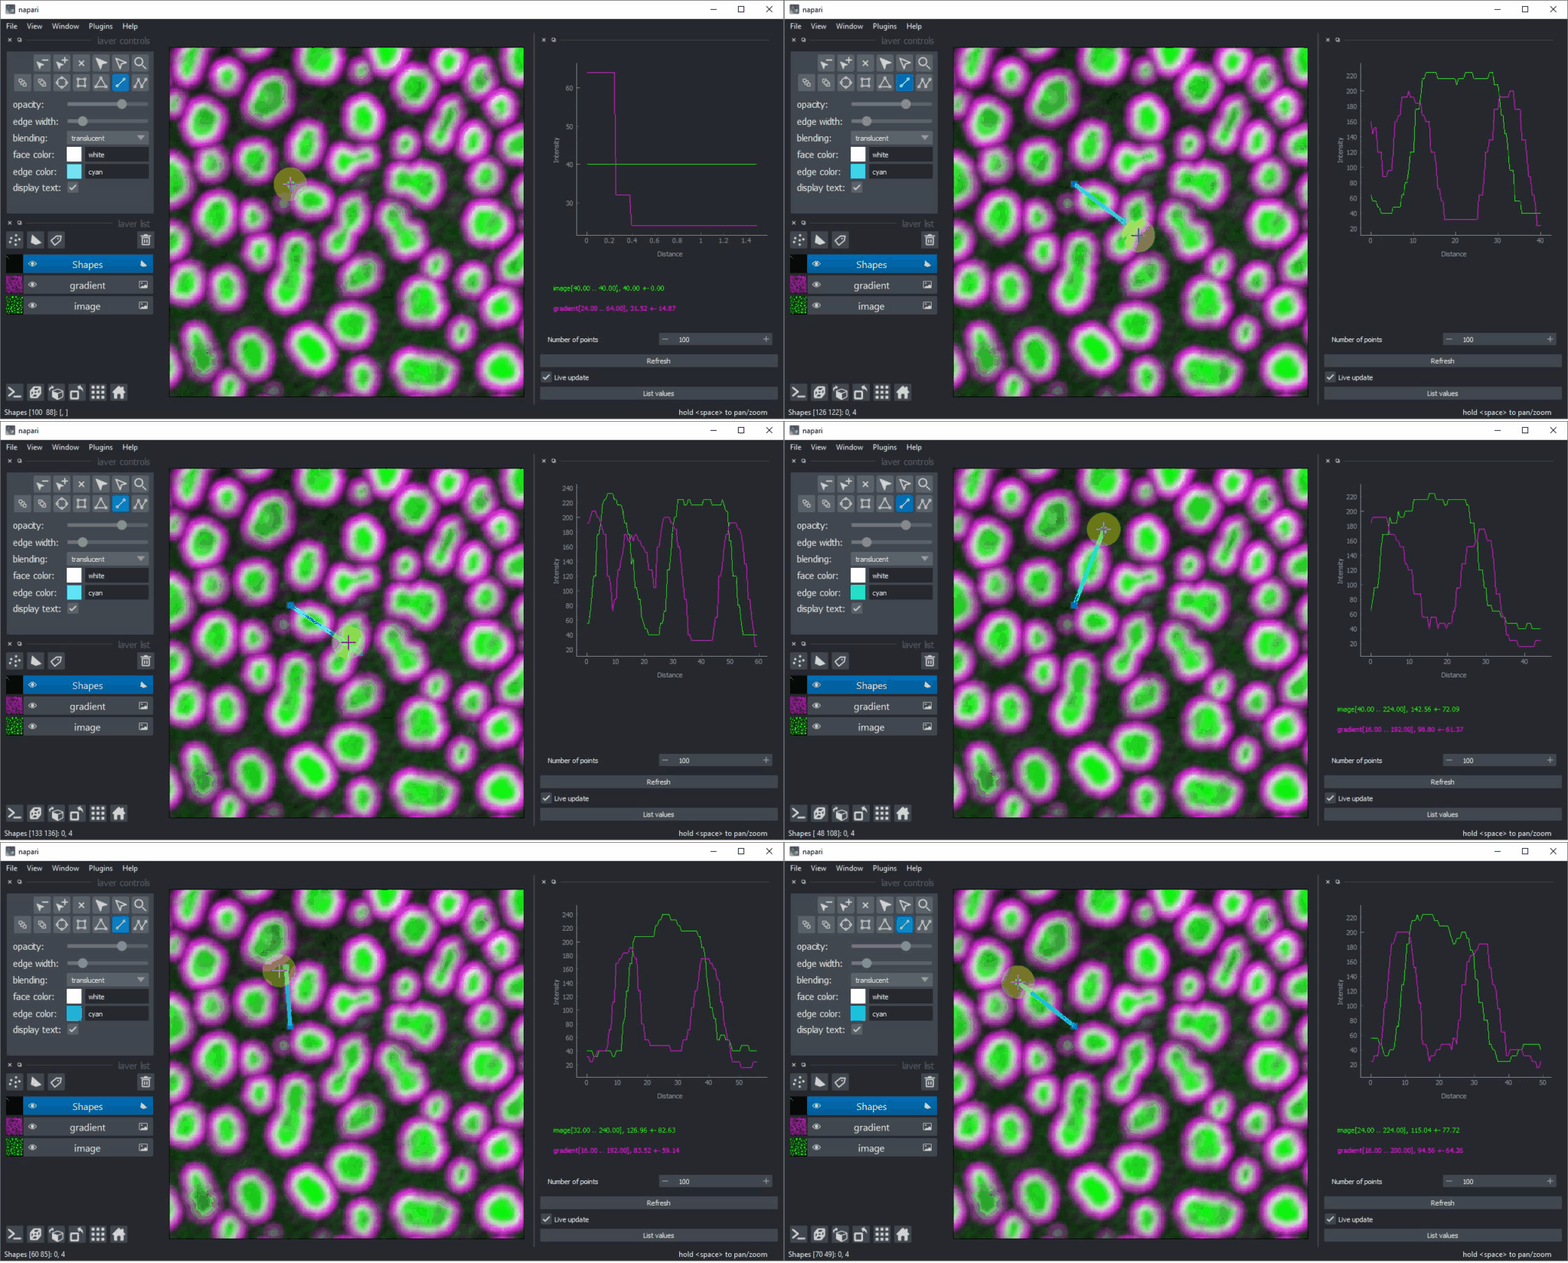
Plot intensities along a line in napari.
Usage
-
Open some images in napari.
-
Add a shapes layer.
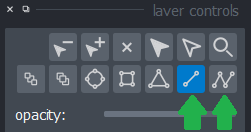
- Activate the line drawing tool or the path tool and draw a line.
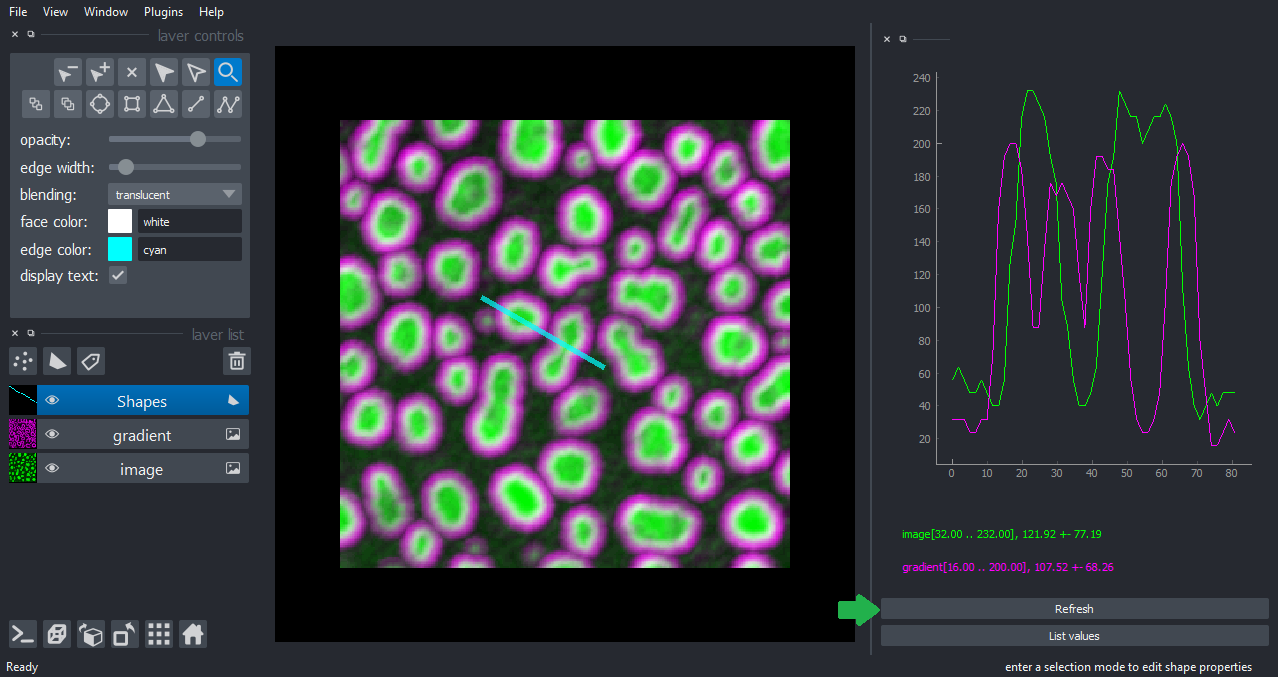
- After drawing a line, click on the menu Plugins > Measurements (Plot Profile)
- If you modify the line, you may want to click the "Refresh" button to redraw the profile.
To see how these steps can be done programmatically from python, check out the demo notebook
This napari plugin was generated with Cookiecutter using with @napari's cookiecutter-napari-plugin template.
Installation
You can install napari-plot-profile via pip:
pip install napari-plot-profile
Contributing
Contributions are very welcome. Tests can be run with tox, please ensure the coverage at least stays the same before you submit a pull request.
License
Distributed under the terms of the BSD-3 license, "napari-plot-profile" is free and open source software
Issues
If you encounter any problems, please create a thread on image.sc along with a detailed description and tag @haesleinhuepf.
Project details
Release history Release notifications | RSS feed
Download files
Download the file for your platform. If you're not sure which to choose, learn more about installing packages.
Source Distribution
Built Distribution
Hashes for napari-plot-profile-0.1.6.tar.gz
| Algorithm | Hash digest | |
|---|---|---|
| SHA256 | 1e67c72f711dea708e443d8c6e2c968707482727241121de821a9804b93923da |
|
| MD5 | 1e172306fe221f6c2e9f44f950ca85f5 |
|
| BLAKE2b-256 | 4af905d96de1b305dc33caeb00233b0aac6d15a84252ee0039f5052c1ae761ba |
Hashes for napari_plot_profile-0.1.6-py3-none-any.whl
| Algorithm | Hash digest | |
|---|---|---|
| SHA256 | 3d8597302f9ed4028d8b66cb2c766ecfd75f16e86d7a94634f97e7fd2852290a |
|
| MD5 | 707ffbb4b1da068ed52056c25662277f |
|
| BLAKE2b-256 | d0856d2a681854991cd5b11d60e7aafc6d6b1f5c0693f49af48b25b6400ab145 |


