Segment organoids and measure intensities

Project description
napari-segment


Interactively segment organoids/spheroids/aggregates in brightfield/fluorescence from nd2 multipositional stack.
Installation
pip install napari-segment
or
From napari plugin

Usage for segmentation
- Drag your nd2 file into napari (otherwise try the Sample data from File / Open Sample / napari-segment)
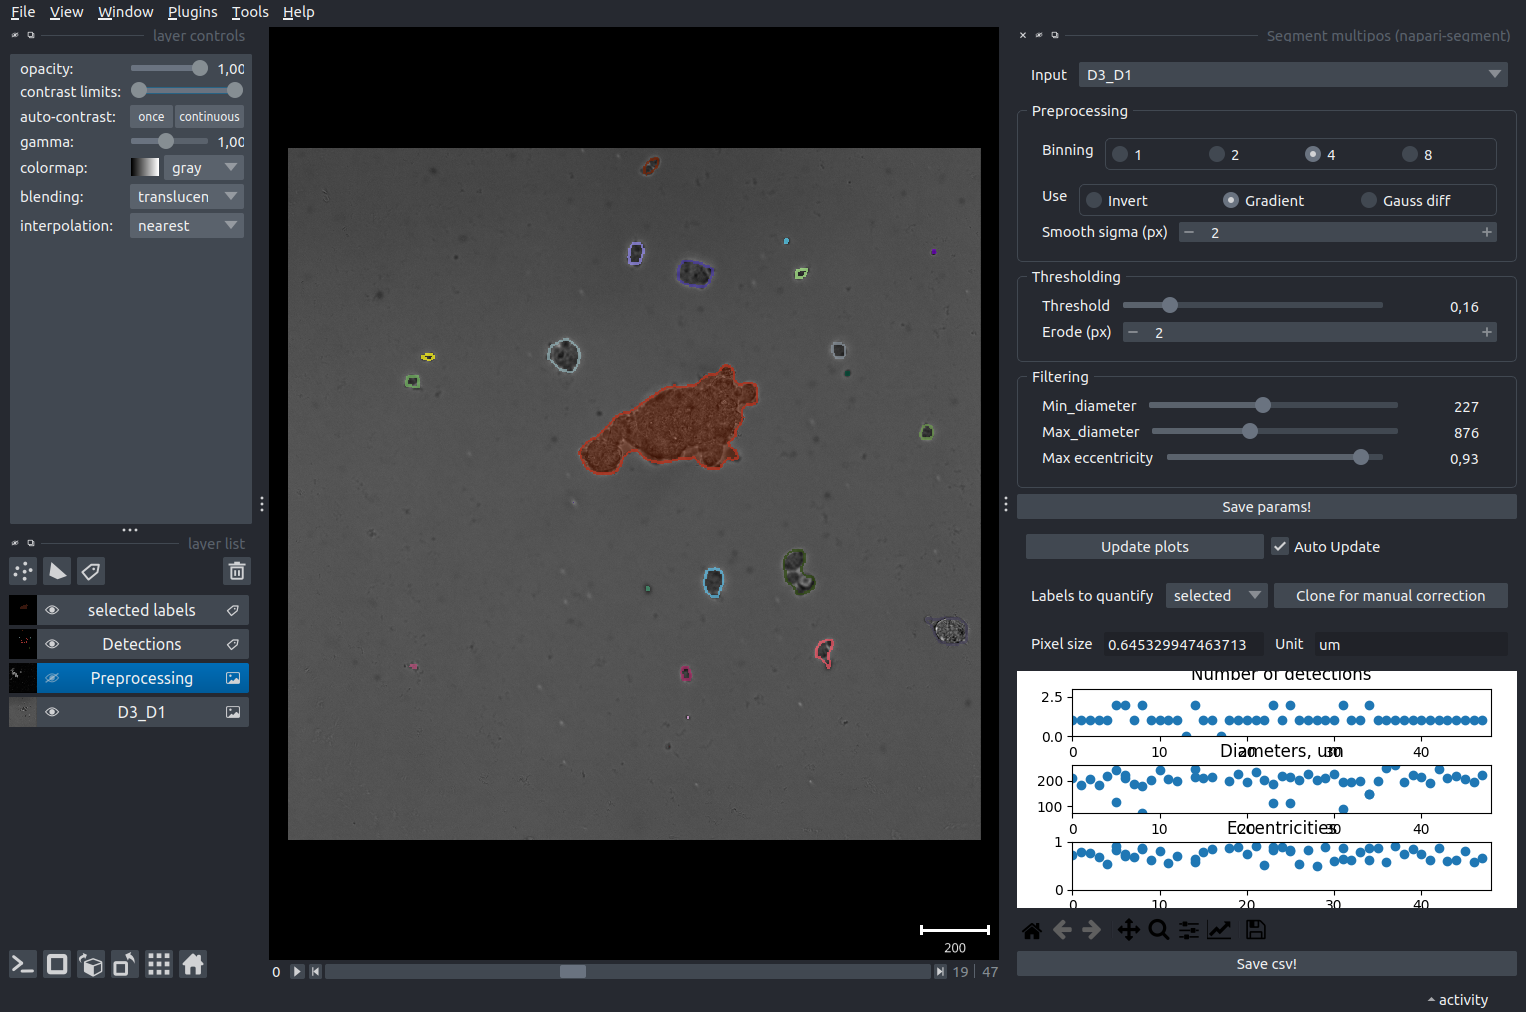
- Lauch Plugins -> napari-segment: Segment multipos
- Select the brightfield channel
- The data is lazily loaded from nd2 dataset and dynamically segmented in the viewer.
- Binning 1-8 allows to skip small features and focus on bigger objects, also makes processing faster.
- Various preprocessing modes allow segmentation of different objects:


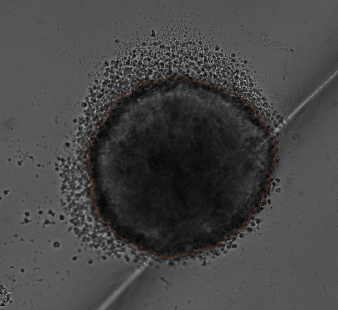
- Invert: will use the dark shadow around aggregate - best for very old aggregates , out of focus (File / Open Sample / napari-segment / Old aggregate)
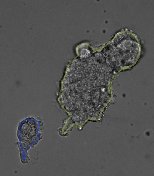
- Gradient: best for very sharp edges, early aggregates, single cells (File / Open Sample / napari-segment / Early aggregate)
- Gauss diff: Fluorescence images The result of preprocessing will be shown in the "Preprocessing" layer.
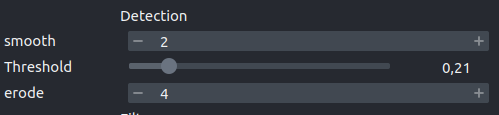
- Smooth, Theshold and Erode parameters allow you to adjust the preliminary segmentation -> they all will appear in the "Detections" layer as outlines
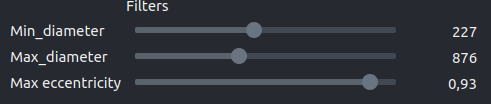
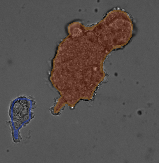
- Min/max diameter and eccentricity allow you to filter out unwanted regions -> the good regions will appear in the "selected labels" layer as filled areas.
-
Once satisfied, click "Save the params!" - it will automatically create file.nd2.params.yml file, so you can recall how the segmentation was done. Next time you open the same dataset, the parameters will be loaded automatically from this file.
-
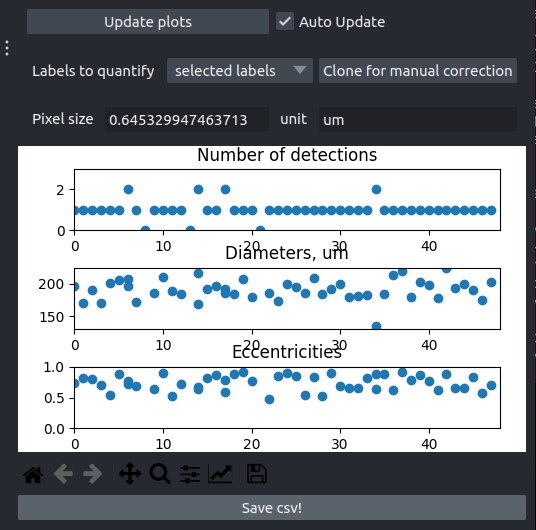
Next section is for quantifying the sizes. Pixel size will be retrieved automatically from metadata. If not: update it manually and click Update plots to see the correct sizes. Click on any suspected value to see the corresponding frame and try to adjust the above parameters.
-
If impossible to get good results with automatic pipeline, click Clone for manual correction: this will create an editable "Manual" layer which you can edin with built-in tools in napari. Click "Update plots" to see the updated values.
-
"Save csv!" will generate a csv file with regionprops.
Contributing
Contributions are very welcome. Tests can be run with tox, please ensure the coverage at least stays the same before you submit a pull request.
License
Distributed under the terms of the BSD-3 license, "napari-segment" is free and open source software
Issues
If you encounter any problems, please file an issue along with a detailed description.
Release history Release notifications | RSS feed


Download files
Download the file for your platform. If you're not sure which to choose, learn more about installing packages.
Source Distribution
Built Distribution
Filter files by name, interpreter, ABI, and platform.
If you're not sure about the file name format, learn more about wheel file names.
Copy a direct link to the current filters
File details
Details for the file napari_segment-0.3.12.tar.gz.
File metadata
- Download URL: napari_segment-0.3.12.tar.gz
- Upload date:
- Size: 22.6 kB
- Tags: Source
- Uploaded using Trusted Publishing? Yes
- Uploaded via: twine/4.0.2 CPython/3.11.5
File hashes
| Algorithm | Hash digest | |
|---|---|---|
| SHA256 |
de092bab18df1980a39fb13dcd4712d9a4c377822cd02d3e62c8023d411ada05
|
|
| MD5 |
b884129a9be9f67fa1abb8cb0bd61d18
|
|
| BLAKE2b-256 |
3651794a16a49a169f8bae506dcdbfc2c869f7a35137eb2e0a55fd29d9942908
|
File details
Details for the file napari_segment-0.3.12-py3-none-any.whl.
File metadata
- Download URL: napari_segment-0.3.12-py3-none-any.whl
- Upload date:
- Size: 18.4 kB
- Tags: Python 3
- Uploaded using Trusted Publishing? Yes
- Uploaded via: twine/4.0.2 CPython/3.11.5
File hashes
| Algorithm | Hash digest | |
|---|---|---|
| SHA256 |
c71cc7a98e6edcfbb68919df5bcabb682a8d2e5a60d4fb7b3808c9269d5ef264
|
|
| MD5 |
b70bd0e71aedc4b5d194bcf7ca3dd134
|
|
| BLAKE2b-256 |
d2e795b48c7752d87b0b59126c883e5dcf7c611ebd33e05a4d892669107d706f
|


