A simple plugin to batch segment cells with cellpose

Project description
napari-serialcellpose


This napari plugin allows to segment all images within a folder using cellpose. The cellpose model can be either a custom model or an official cellpose model. In addition, a set of geometrical properties can be visualized as histograms for each image or for the entire folder. The set of properties is currently fix, but we plan to make those selectable.
This plugin uses the great napari-skimage-regionprops plugin to show properties as interactive tables.
Installation
In order to let users choose whether they want to use the GPU or not for segmentation, cellpose is not added as a dependency of this package. Therefore, to use this plugin you need to create an environment and install a few packages manually. First create the environment:
conda create -n serialcellpose python=3.8.5
Then activate it and install napari and the plugin:
conda activate serialcellpose
pip install "napari[all]"
pip install git+https://github.com/guiwitz/napari-serialcellpose.git
CPU
Then for CPU work, just install cellpose in the regular way:
pip install cellpose
GPU
For GPU work, you just need to make sure that you have an NVIDIA card and the appropriate driver for it. Then you can install PyTorch via conda using a command that you can find here (this takes care of the cuda toolkit, cudnn etc. so no need to install manually anything more than the driver). The command will look like this:
conda install pytorch torchvision cudatoolkit=11.3 -c pytorch
Finally you can install cellpose:
pip install cellpose
Note that it is important to install pytorch before cellpose, otherwise cellpose will install non-GPU dependencies.
Plugin Updates
To update the plugin, you only need to activate the existing environment and install the new version:
conda activate serialcellpose
pip install git+https://github.com/guiwitz/napari-serialcellpose.git -U
Usage: segmentation
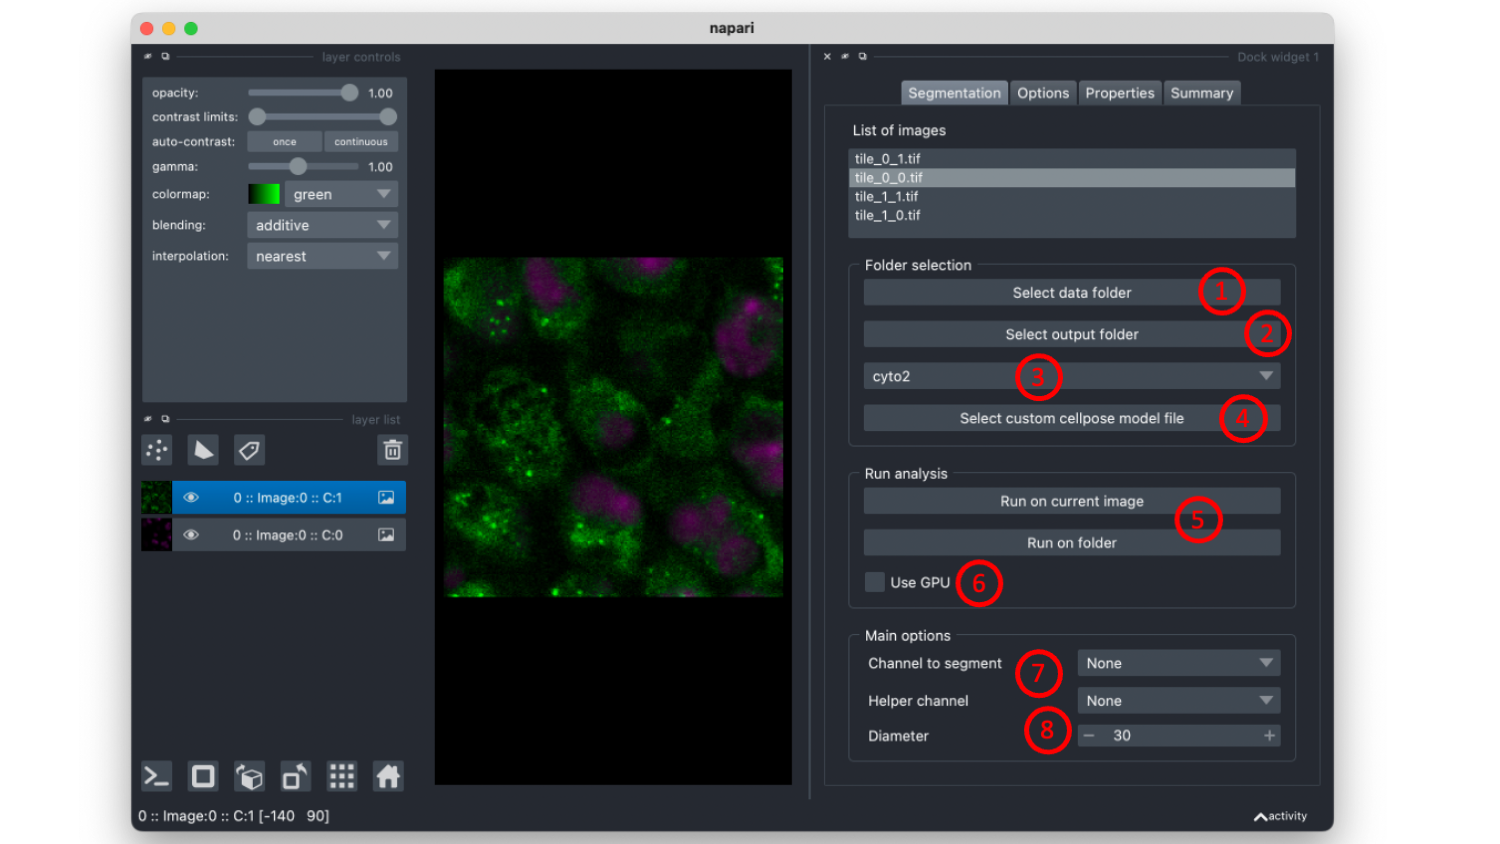
The main interface is shown below. The sequence of events should be the following:
- Select a folder containing images. Either gray scale images or RGB that are then converted to gray scale. Once selected, the list of files will appear in the window above. When selecting an image, it gets displayed in the viewer.
- Select a folder that will contain the output (segmentations and tables)
- Select the type of cellpose model.
- If you use a custom model, select it.
- Set parameters. If you use an official cellpose model, you can e.g. set the diameter. You can also set how many images are sent together for analysis as a batch (for GPU, this will depend on the memory size. For CPU the effect is marginal).
- Select if you want to use a GPU or not.
- Run the analysis on the currently selected image or on all files in the folder.
The results of the analysis are saved in the folder chosen in #2. The segmentation mask is saved with the same name as the original image with the suffix _mask.tif. A table with properties is saved in the subfolder tables also with the same name as the image with the suffix props.csv.
Usage: post-processing
After the analysis is done, when you select an image, the corresponding segmentation mask is shown on top of the image as shown below. This also works for saved segmentations: in that case you just select a folder with data and the corresponding output folder.
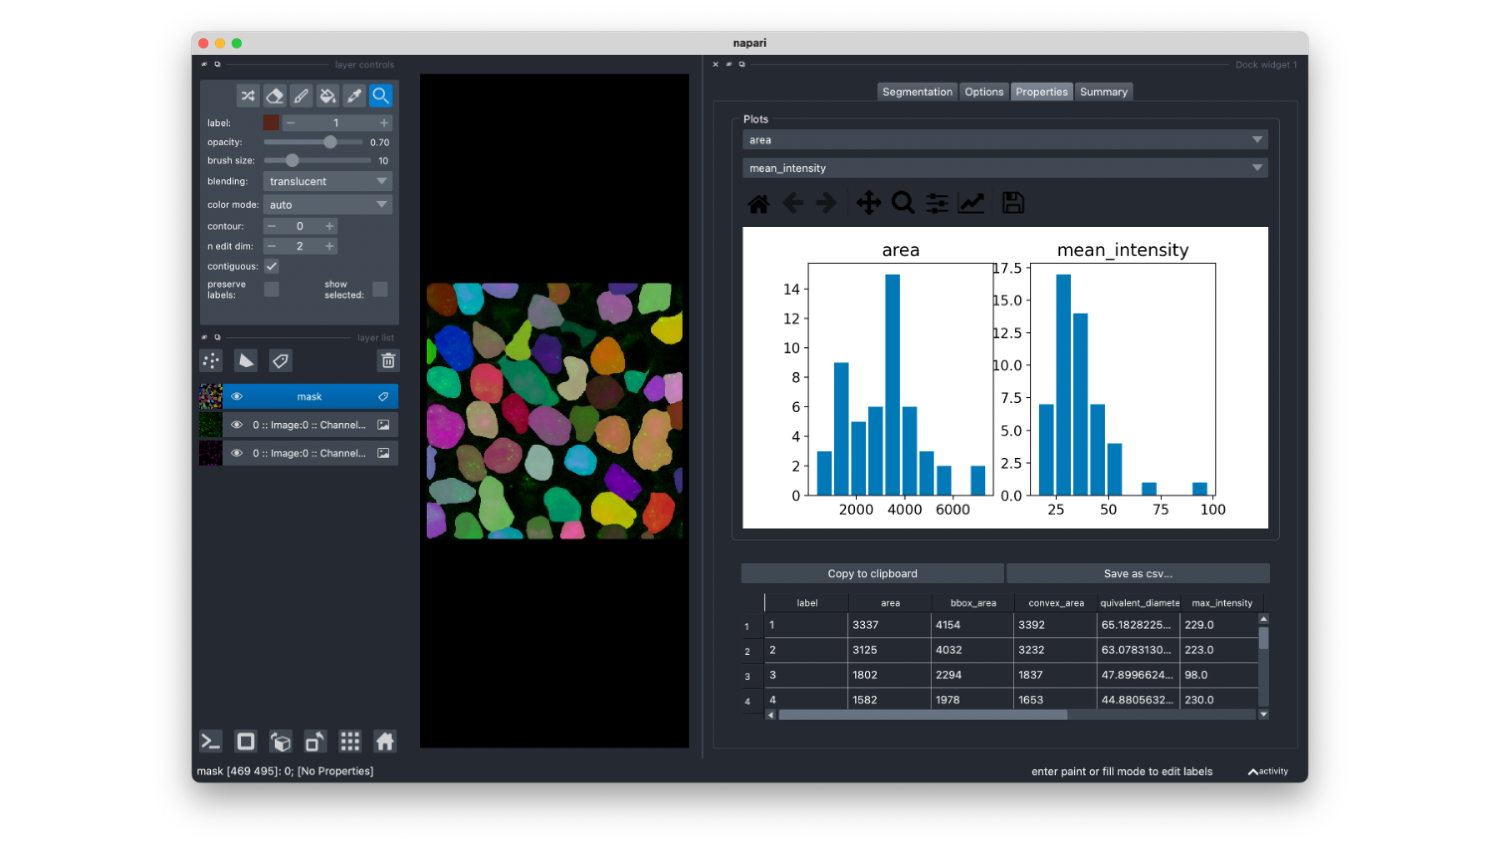
If you head to the Properties tab, you will find there two histograms showing the distribution of eccentricity and maximum Feret diameter. Below you find the table containing information for each cell (each line is a cell).
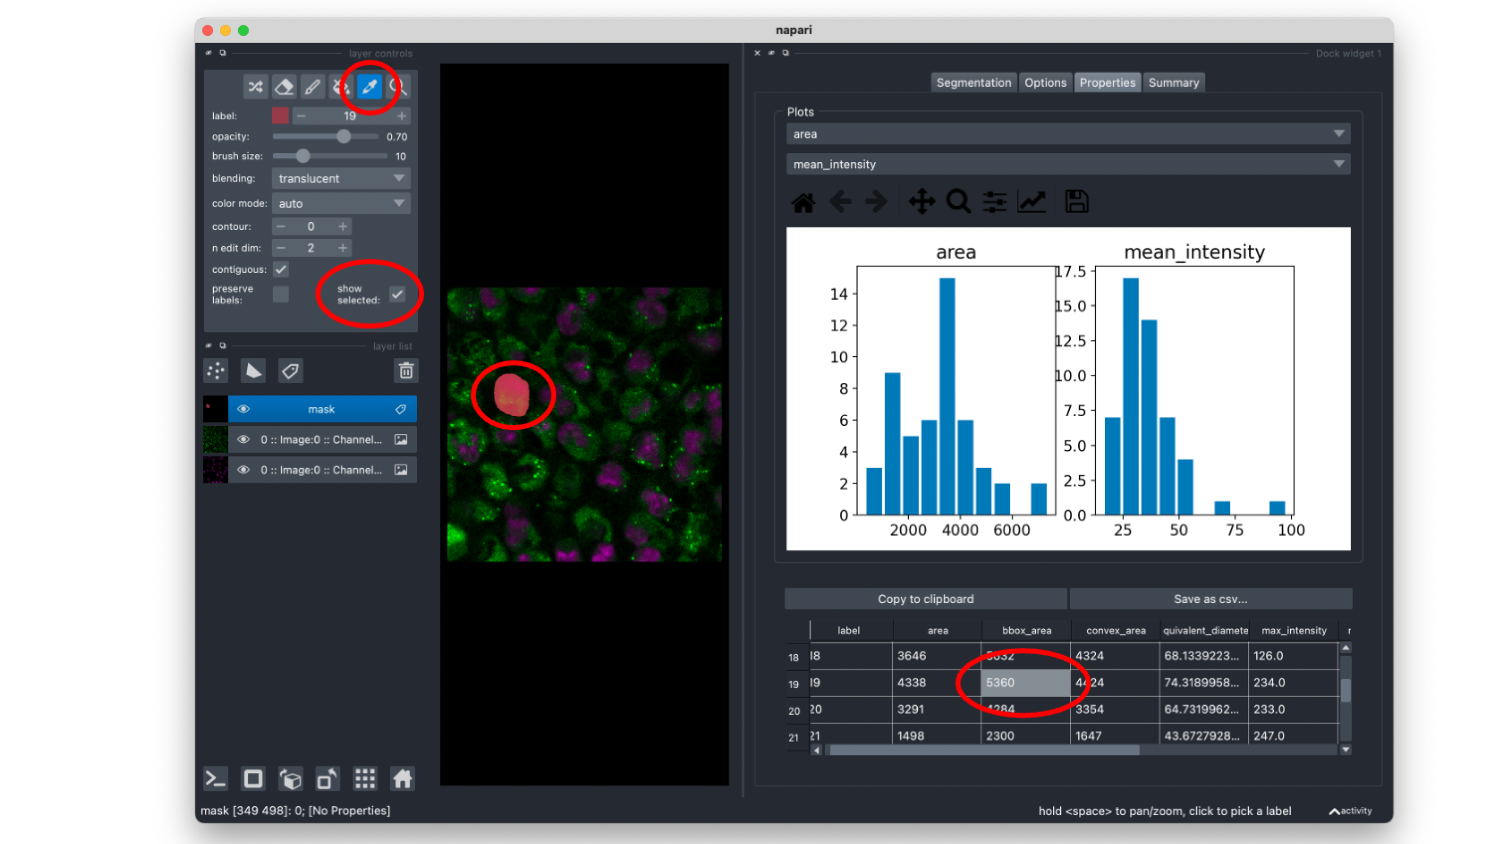
As shown below, if you select the box show selected, you can select items in the properties table and it will highlight the corresponding cell in the viewer. If you select the pipet tool, you can also select a cell and see the corresponding line in the table highlighted.
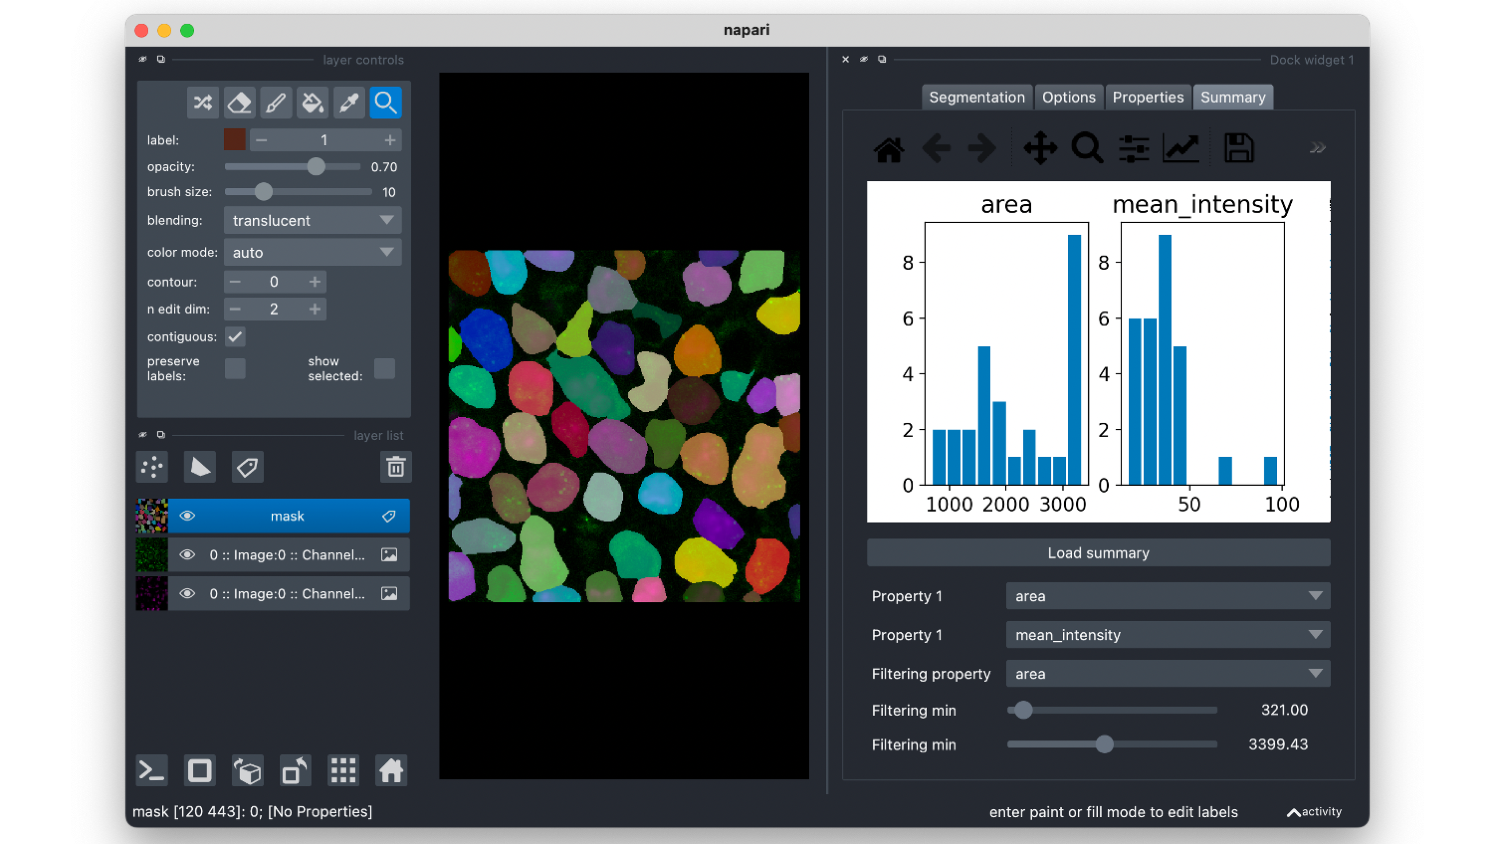
Finally if you select the Summary tab, and click on Load summary, it will load all data of the given folder and create histograms of eccentricity and Feret diameter. The slider allows to put a threshold on eccentricity in order to select only round cells.
License
Distributed under the terms of the BSD-3 license, "napari-serialcellpose" is free and open source software
Issues
If you encounter any problems, please file an issue along with a detailed description.


Download files
Download the file for your platform. If you're not sure which to choose, learn more about installing packages.
Source Distribution
Built Distribution
Filter files by name, interpreter, ABI, and platform.
If you're not sure about the file name format, learn more about wheel file names.
Copy a direct link to the current filters
File details
Details for the file napari-serialcellpose-0.1.2.tar.gz.
File metadata
- Download URL: napari-serialcellpose-0.1.2.tar.gz
- Upload date:
- Size: 2.1 MB
- Tags: Source
- Uploaded using Trusted Publishing? No
- Uploaded via: twine/4.0.1 CPython/3.10.5
File hashes
| Algorithm | Hash digest | |
|---|---|---|
| SHA256 |
39bea9757694fbff73730b3191ab1e213d06ae3ed1284ca32911b01cd50ca51f
|
|
| MD5 |
e20adfa99c6bc629a1e13cdfe48b8a14
|
|
| BLAKE2b-256 |
1ecf41ec756833a998bad16e93bcac3df4d78481910274f621b855be9222b300
|
File details
Details for the file napari_serialcellpose-0.1.2-py3-none-any.whl.
File metadata
- Download URL: napari_serialcellpose-0.1.2-py3-none-any.whl
- Upload date:
- Size: 12.9 kB
- Tags: Python 3
- Uploaded using Trusted Publishing? No
- Uploaded via: twine/4.0.1 CPython/3.10.5
File hashes
| Algorithm | Hash digest | |
|---|---|---|
| SHA256 |
c14f95e34ff8d73cdccd5752bcad2bb565263ec96151ca36889f94b130ad9033
|
|
| MD5 |
9fa6367be7e2076b432bc50baf6cbebb
|
|
| BLAKE2b-256 |
985aef704177a1b0ca501460057dcf95d2b6b8814a99da976904d91b8cac4955
|


