Interactively visualize networks with Ulf Aslak's d3-tool from Python.
Project description

logo
netwulf
This package provides an interface between networkx Graph objects and Ulf Aslak’s interactive web app for simple and better network visualizations.
Install
pip install netwulf
Beware: netwulf only works with Python 3!
Example
Standard
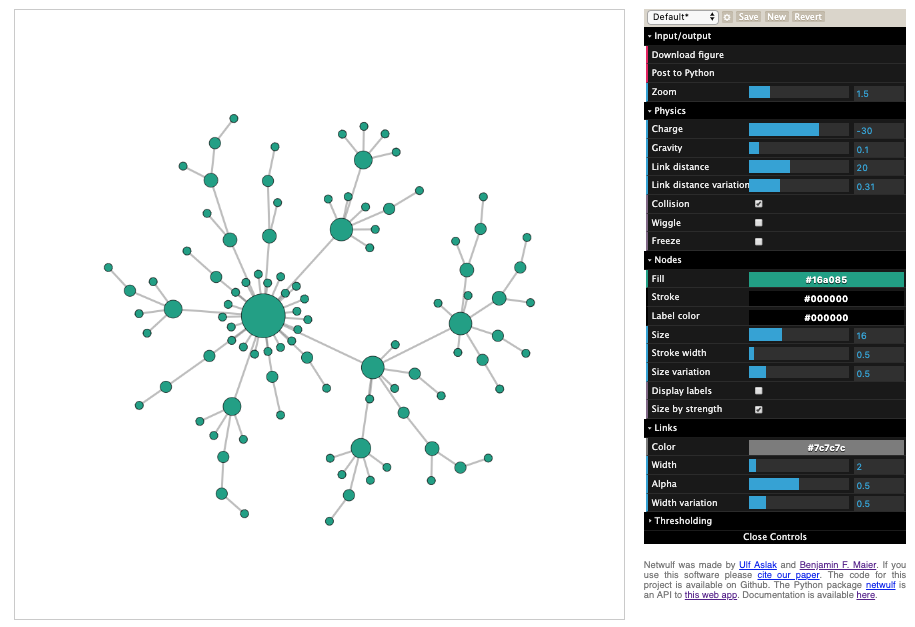
Create a network and look at it
import networkx as nx
from netwulf import visualize

G = nx.barabasi_albert_graph(100,m=1)
visualize(G)
visualization example
Config
It’s possible to change the default settings which are
default_config = {
  'Apply heat (wiggle)': False,
  'Charge strength': -10,
  'Center gravity': 0.1,
  'Link distance': 10,
  'Link width': 2,
  'Link alpha': 0.5,
  'Node size': 10,
  'Node stroke size': 0.5,
  'Node size exponent': 0.5,
  'Link strength exponent': 0.1,
  'Link width exponent': 0.5,
  'Collision': False,
  'Node fill': '#16a085',
  'Node stroke': '#000000',
  'Link stroke': '#7c7c7c',
  'Label stroke': '#000000',
  'Show labels': False,
  'Zoom': 1.5,
  'Min. link weight %': 0,
  'Max. link weight %': 100
}
It’s done like so:
import networkx as nx
from netwulf import visualize

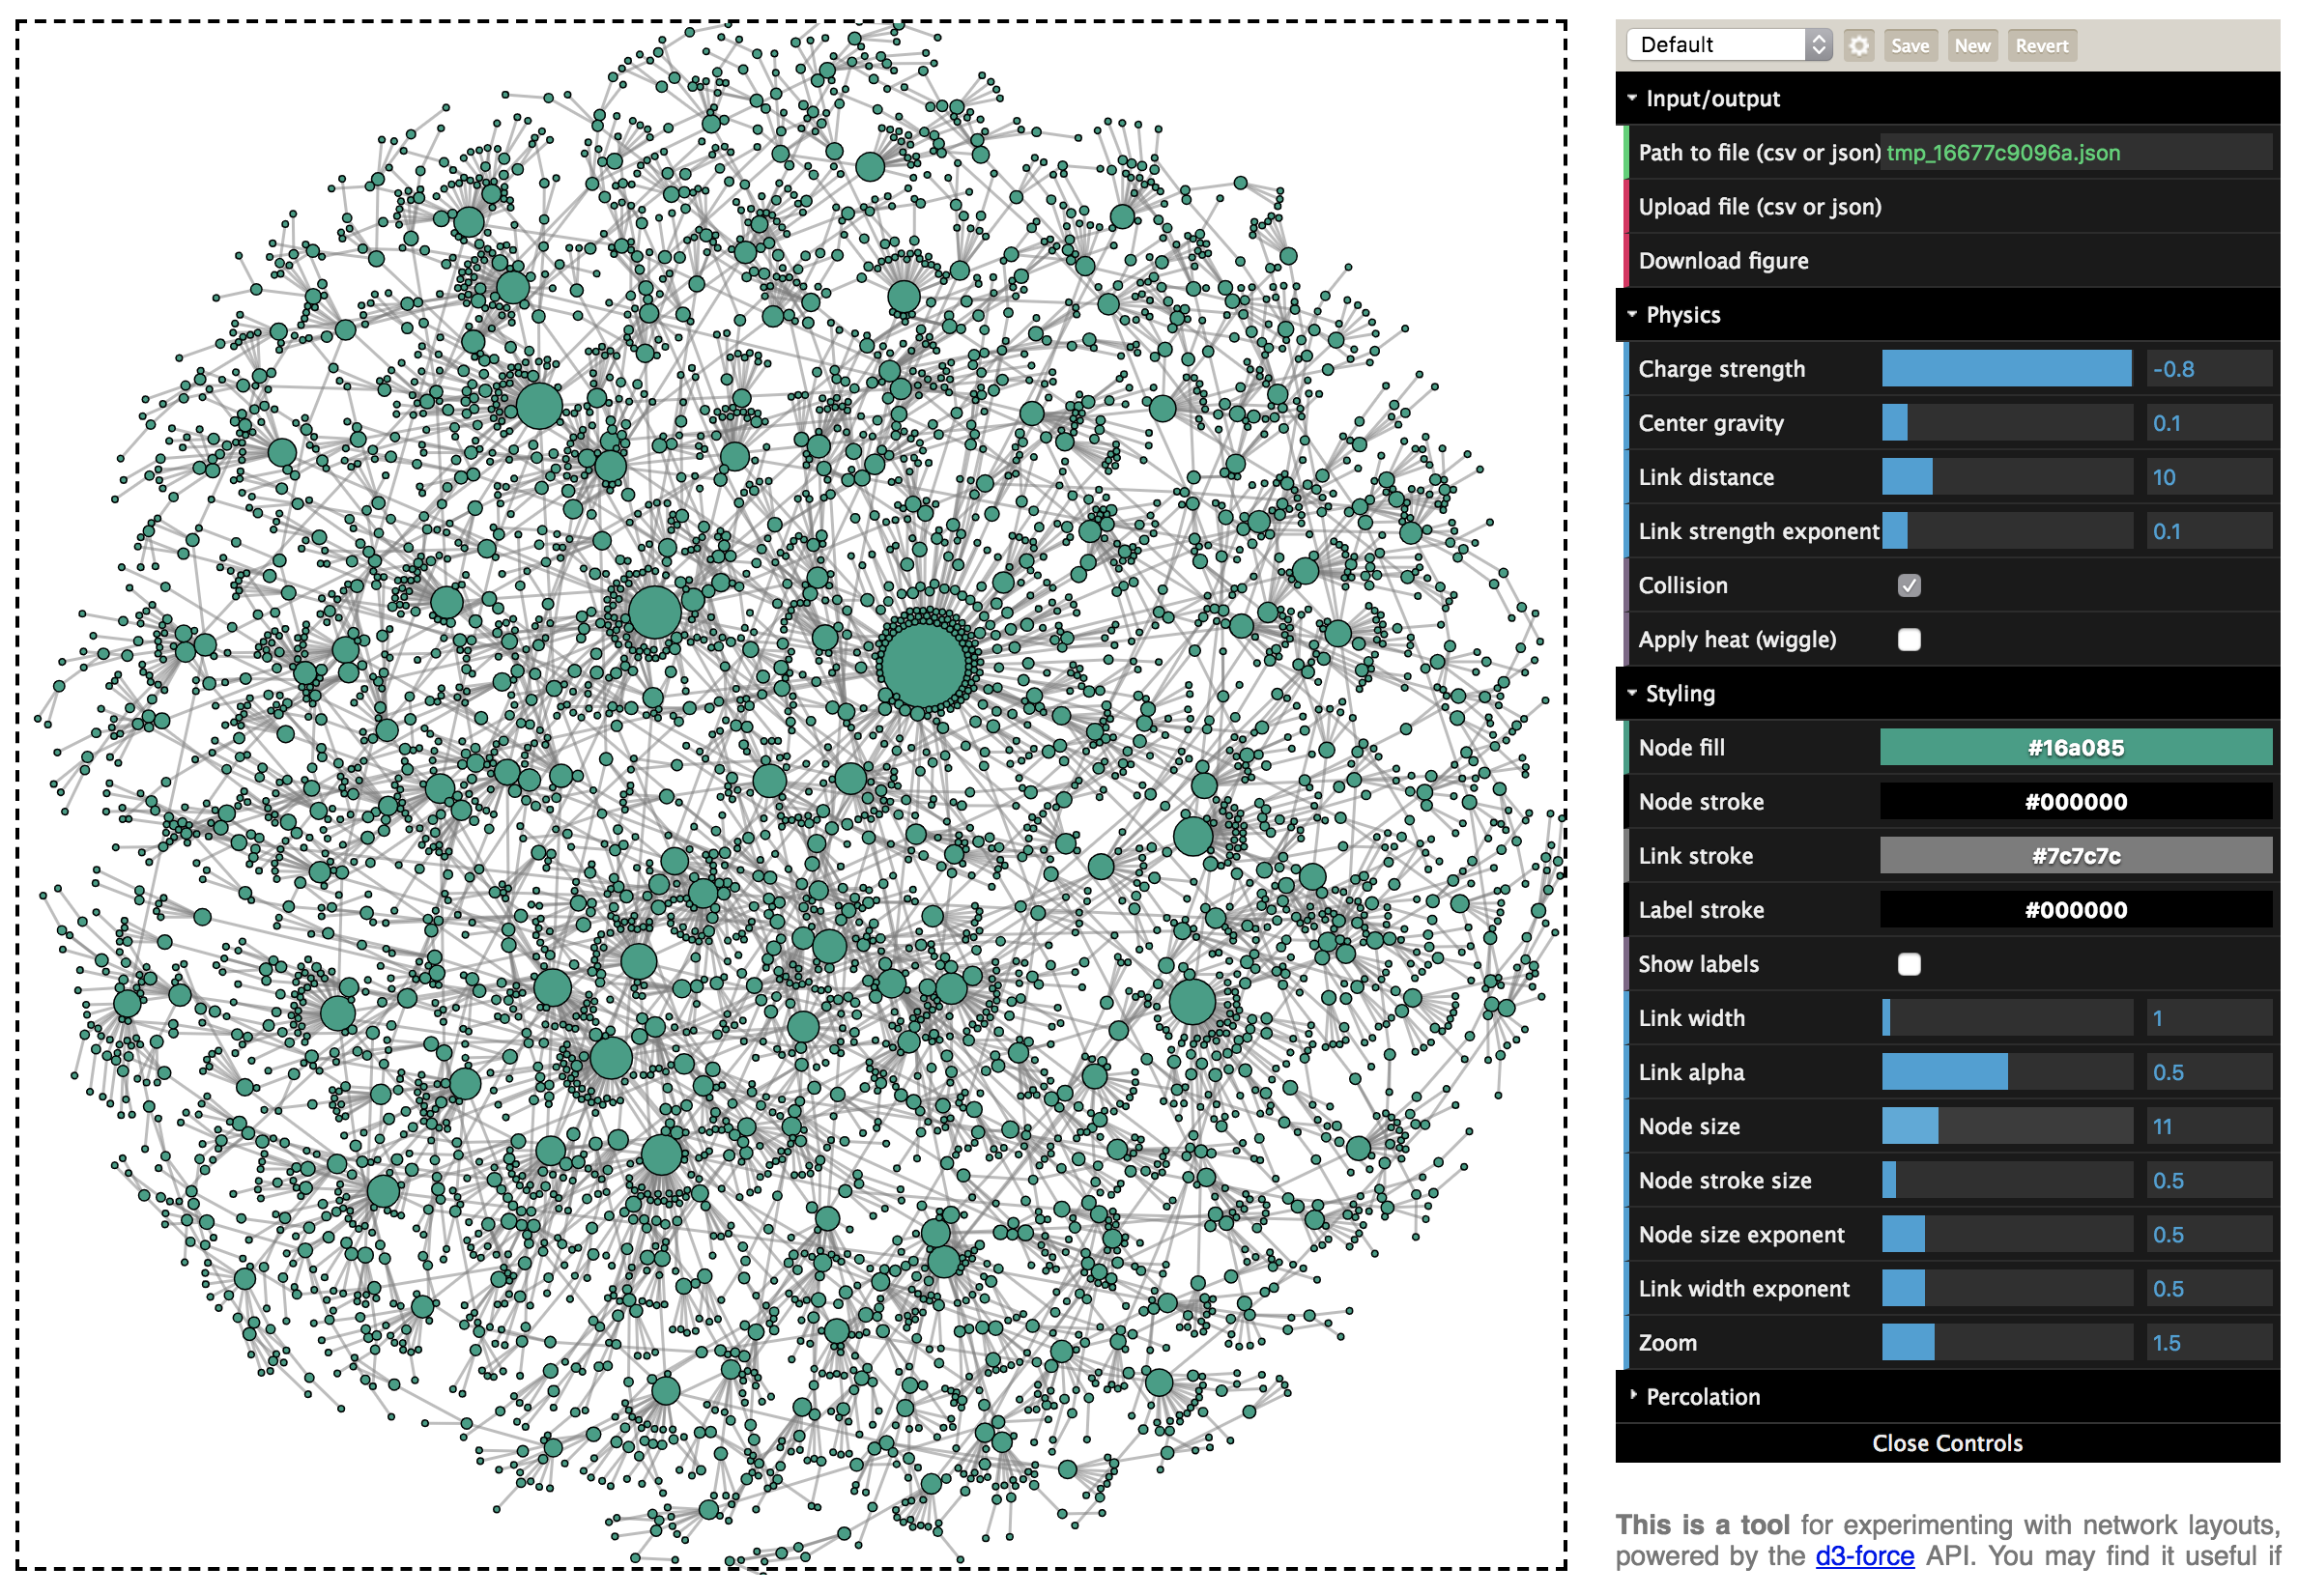
G = nx.barabasi_albert_graph(5000,m=1)
visualize(G,config={
        'Node size': 11,
        'Charge strength' : -0.8,
        'Link distance' : 10,
        'Link width' : 1,
        'Collision' : True,
    })
visualization example
Project details
Release history Release notifications | RSS feed
Download files
Download the file for your platform. If you're not sure which to choose, learn more about installing packages.
Source Distribution
netwulf-0.0.8.tar.gz
(218.9 kB
view hashes)


