
GitHub following network visualizer for Humans




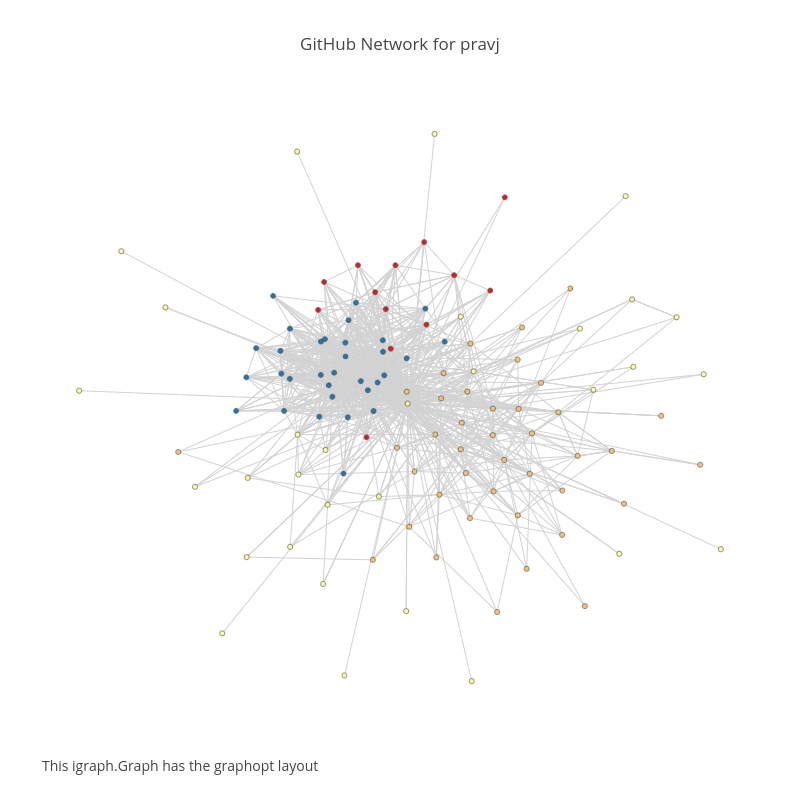
octogrid in action
Installation
pip install octogrid
If you are facing issues (on Linux) with ‘python-igraph’, you should consider installing required libraries first.
apt-get install -y libigraph0-dev
How to
You need to create an account on Plotly to see your visualizations, it’s free.
Once you have an account there, execute the following in your terminal to setup your user credentials.
python -c “import plotly; plotly.tools.set_credentials_file(username=’USERNAME’, api_key=’APIKEY’)”
Your API key can be collected from here.
All these steps aren’t compulsory, though. If you leave them, octogrid will create plots via its own account.
Usage
octogrid generate [–reset] [–user=<username>]
Generate the GML file for user representing its GitHub following graph
octogrid publish [–reset] [–user=<username>]
Publish the user’s GitHub community graph using Plotly
–reset (optional) flag is used to clear the cache storage for a given user
Powered By
![Plotly [Image Credit : Pensrulerstape - Own work, CC BY-SA 4.0, $3]](https://pypi-camo.freetls.fastly.net/d037297aac03e677d671d8a23021aaa456b3ff05/68747470733a2f2f6769746875622e636f6d2f707261766a2f676974706f6f6c2f7261772f6d61737465722f6f63746f677269642f706c6f746c792d6c6f676f2e706e67)
License
MIT © Plotly.
1 maintainer

Metadata
1 maintainer
Release files for octogrid 1.3.0
For a detailed explanation of source distributions (sdists) and built distributions (wheels), please see the package formats documentation.
Source distribution (sdist)
| File | Size | Uploaded | |
|---|---|---|---|
| octogrid-1.3.0.tar.gz | 9.3 kB | Details |
Release files / octogrid-1.3.0.tar.gz
| Download URL | octogrid-1.3.0.tar.gz |
|---|---|
| Size | 9.3 kB |
| Tags | Source |
|
SHA-256 checksum How to use checksums |
b3f8dffa564ddba9d38761495bf95ea9cd58c53c6cd2d4422d71893fae44f7bc
|
|
BLAKE2b-256 checksum How to use checksums |
d06c876975c4b850db17e36e6d898a3b7875b9bfe6c7d3696939abf7eb0c82c1
|
| Upload date | |
|
Uploaded using Trusted Publishing? What is trusted publishing? |
No |














