Draw json fields with graphs.

Project description


This module allows to load a line graph per ordered pair from an One2many or Many2many field.
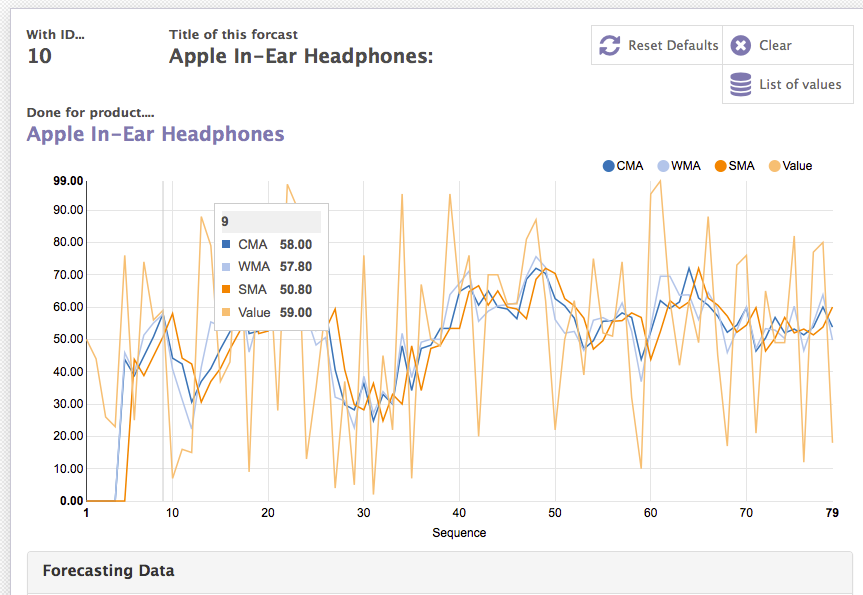
Table of contents
Usage
Use this widget by including:
<field name="field_text_json" widget="json_graph" />
For example:
<field name="values_data" widget="json_graph"/>
The JSON needs to be like:
fields = ['field1', 'field2', 'field3', ...]
field_x = 'field_x'
dictionary = self.value_ids.sorted(field_x).read(fields)
color = {
    'field1': HEXCOLOR1,
    'field2': '#FFBB78',
    'field3': '#1F77B4',
    ...
}
dictionary = self.value_ids.sorted(field_x).read(fields)
content = {}
data = []
for field in fields:
    if field != field_x:
        content[field] = []
        for rec in dictionary:
            content[field].append({'x': rec[field_x], 'y': rec[field]})
        if field in color:
            data.append({'values': content[field], 'key': field,
                'color': color[field]})
            continue
        data.append({'values': content[field], 'key': field})
info = {
    'label_x': 'X Label',
    'label_y': 'Y label',
    'data': data
}
self.field_text_json = json.dumps(info)
For example:
fields = ['sequence', 'value', 'sma', 'cma']
field_x = 'sequence'
dictionary = self.value_ids.sorted(field_x).read(fields)
color = {
    'value': '#2CA02C',
    'sma': '#FFBB78'
}
dictionary = self.value_ids.sorted(field_x).read(fields)
content = {}
data = []
for field in fields:
    if field != field_x:
        content[field] = []
        for rec in dictionary:
            content[field].append({'x': rec[field_x], 'y': rec[field]})
        if field in color:
            data.append({'values': content[field], 'key': field,
                'color': color[field]})
            continue
        data.append({'values': content[field], 'key': field})
info = {
    'label_x': 'Sequence',
    'label_y': '',
    'data': data
}
self.values_data = json.dumps(info)
Known issues / Roadmap
nolabel is ignored, this image will never bring a label, by default simply use an extra separator.
A graph will always use 100% of the width, pending the css dynamic attribute.
Height is harcoded.
Bug Tracker
Bugs are tracked on GitHub Issues. In case of trouble, please check there if your issue has already been reported. If you spotted it first, help us to smash it by providing a detailed and welcomed feedback.
Do not contact contributors directly about support or help with technical issues.
Credits
Contributors
Francisco Luna <fluna@vauxoo.com>
José Robles <josemanuel@vauxoo.com>
Luis González <lgonzalez@vauxoo.com>
Nhomar Hernández <nhomar@vauxoo.com>
Other credits
Vauxoo
Maintainers
This module is maintained by the OCA.

OCA, or the Odoo Community Association, is a nonprofit organization whose mission is to support the collaborative development of Odoo features and promote its widespread use.
Current maintainer:

This module is part of the OCA/web project on GitHub.
You are welcome to contribute. To learn how please visit https://odoo-community.org/page/Contribute.
Release history Release notifications | RSS feed


Download files
Download the file for your platform. If you're not sure which to choose, learn more about installing packages.
Source Distributions
Built Distribution
Filter files by name, interpreter, ABI, and platform.
If you're not sure about the file name format, learn more about wheel file names.
Copy a direct link to the current filters
File details
Details for the file odoo12_addon_web_widget_json_graph-12.0.1.0.0.99.dev7-py3-none-any.whl.
File metadata
- Download URL: odoo12_addon_web_widget_json_graph-12.0.1.0.0.99.dev7-py3-none-any.whl
- Upload date:
- Size: 353.7 kB
- Tags: Python 3
- Uploaded using Trusted Publishing? No
- Uploaded via: twine/4.0.1 CPython/3.8.10
File hashes
| Algorithm | Hash digest | |
|---|---|---|
| SHA256 |
454d497f473a793946c94ed389f52c4fea8151c85ac4bcaf55c3737fcacb2218
|
|
| MD5 |
d0047cd67a1b8035a60e5fa843db0558
|
|
| BLAKE2b-256 |
3767028559fb46023f395deb89c82e052d4b2c04a40779465829699346bf9a20
|


