3D visualization for the Open Mining Format (omf)
Project description


A PyVista (and VTK) interface for the Open Mining Format package (omf) providing Python 3D visualization and useable mesh data structures for processing datasets in the OMF specification.
Documentation is hosted at https://opengeovis.github.io/omfvista/
Check out the Example Notebook on NBViewer! Or launch the Notebook on MyBinder to run the code yourself!
Installation
Installation is simply:
pip install omfvista
All necessary dependencies will be installed alongside omfvista. Please note that this package heavily leverages the PyVista package.
Questions & Support
For general questions about the project, its applications, or about software usage, please create an issue in the pyvista/pyvista-support repository where the PyVista community can collectively address your questions. You are also welcome to join us on join @OpenGeoVis on our Slack workspace under the #omfvista channel or send one of the developers an email. The project support team can be reached at info@opengeovis.org.
Example Use

Be sure to check out the Example Notebook that demos omfvista or our Example Gallery in the documentation! Here’s an example using the sample data hosted in the OMF repository.
import pyvista as pv
import omfvista

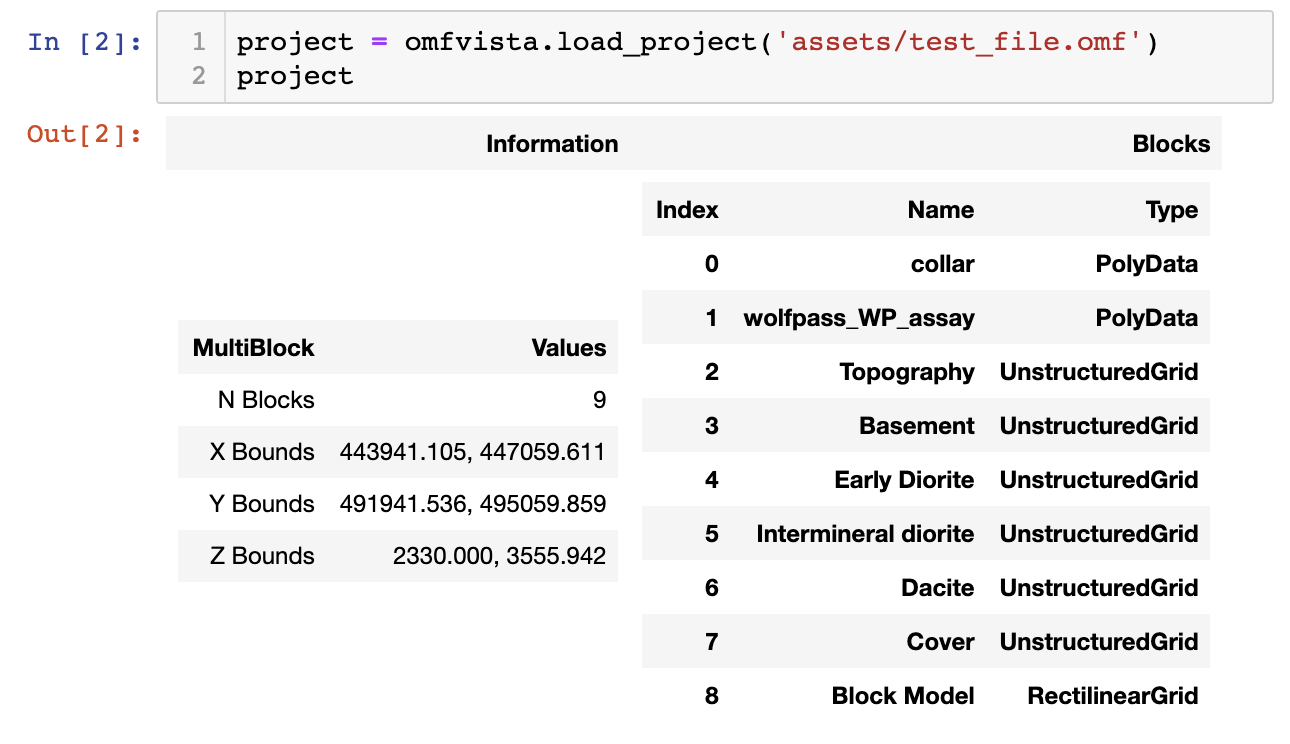
project = omfvista.load_project('test_file.omf')
project
Once the data is loaded as a pyvista.MultiBlock dataset from omfvista, then that object can be directly used for interactive 3D visualization from PyVista:
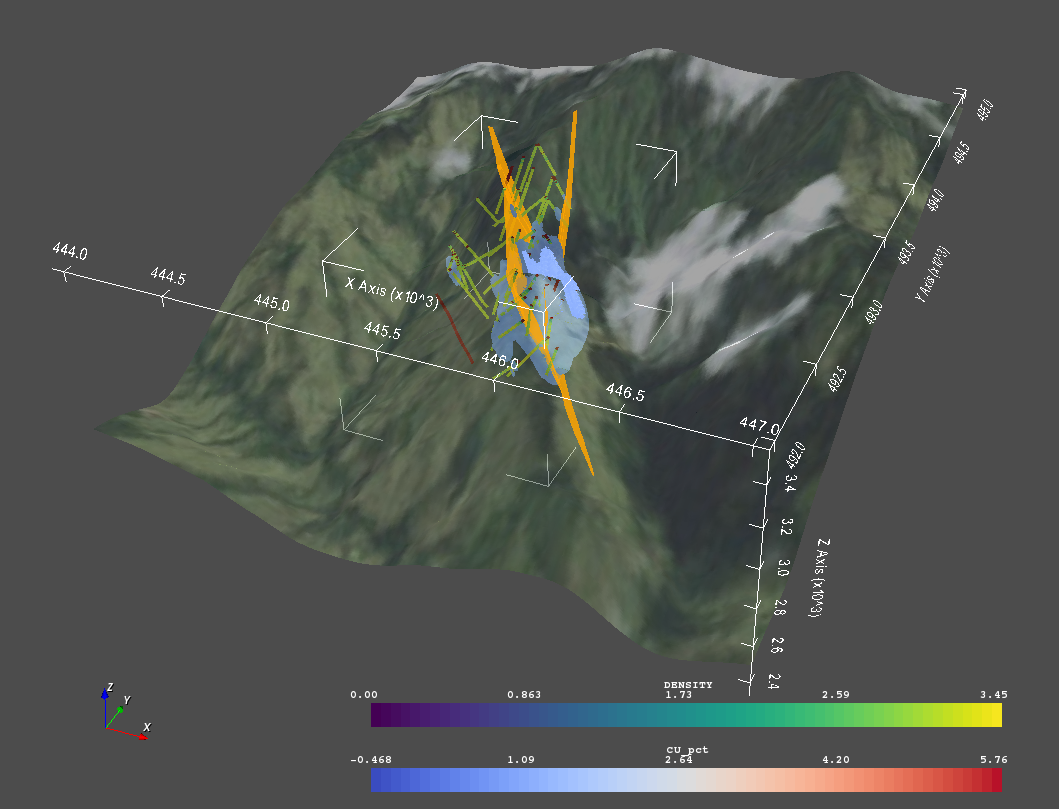
project.plot(notebook=False)Or an interactive scene can be created and manipulated to create a compelling figure directly in a Jupyter notebook. First, grab the elements from the project:
# Grab a few elements of interest and plot em up!
vol = project['Block Model']
assay = project['wolfpass_WP_assay']
topo = project['Topography']
dacite = project['Dacite']
Then apply a filtering tool from PyVista to the volumetric data:
thresher = pv.Threshold(vol)
Then you can put it all in one environment!
# Grab the active plotting window
#  from the thresher tool
p = thresher.plotter
# Add our datasets
p.add_mesh(topo, cmap='gist_earth', opacity=0.5)
p.add_mesh(assay, color='blue', line_width=3)
p.add_mesh(dacite, color='yellow', opacity=0.6)
# Add the bounds axis
p.show_bounds()
And once you like what the render view displays, you can save a screenshot:
p.screenshot('wolfpass.png')
Project details
Download files
Download the file for your platform. If you're not sure which to choose, learn more about installing packages.


