Brain Graph Management and Numerical Model Simulations on Brains
Project description
OpenConnectome
Description
OpenConnectome is a Python package for working with connectome data. It provides tools for loading, processing, analyzing, and visualizing connectomes in a user-friendly manner. The data structure used is the one proposed by the Budapest Reference Connectome and has to be strictly followed. For now, it is not designed to work with any other network except that brain graphs.
The package provides the implementation of a mathematical model describing the development of the Alzheimer's Disease, which is its the main application.
Images and Results


Installation
(TODO) You can install OpenConnectome using pip:
pip install openconnectome
Generalities and Usage
OpenConnectome is designed as a tool for simulating Alzheimer models, offering users a highly accessible way to visualize the resulting data.
It is divided into two main classes: openconnectome and grid3D: the first handles the visualization and analysis of the brain graph, whereas the latter incorporates an adaptive space-grid division technique that aids in estimating specific connectome parameters, such as the proximity radius.
The package is structured in a way that is possible to quickly run articulated commands, such as the whole simulation of an implemented model, but it also provides users with the flexibility to work with custom scripts and aesthetics.
OpenConnectome Methods
-
setIntegrationTime: Specify the time steps in which we want the simulation to be evaluated. It should be a one dimensionalnumpy.ndarray; it will be stored into Connectometimeattribute. -
setA_Range: Specify the a variable range. It should be a one dimensionalnumpy.ndarray; it will be stored into Connectomeaattribute. -
getNodesInRegion: Returns the list of nodes IDs in the requested region. -
getProximityConnectome: Generates the proximity connectome using euclidean metrics. It creates links between nodes that are distant at most r_max. The proximity connectome is stored into ConnectomeG_proxattribute. It can also be accessed directly using the class propertyproximityConnectome. -
getAtrophy: Calculate the atrophy across all the nodes and regions in the brain graph according to the relation described in the PAPER ... -
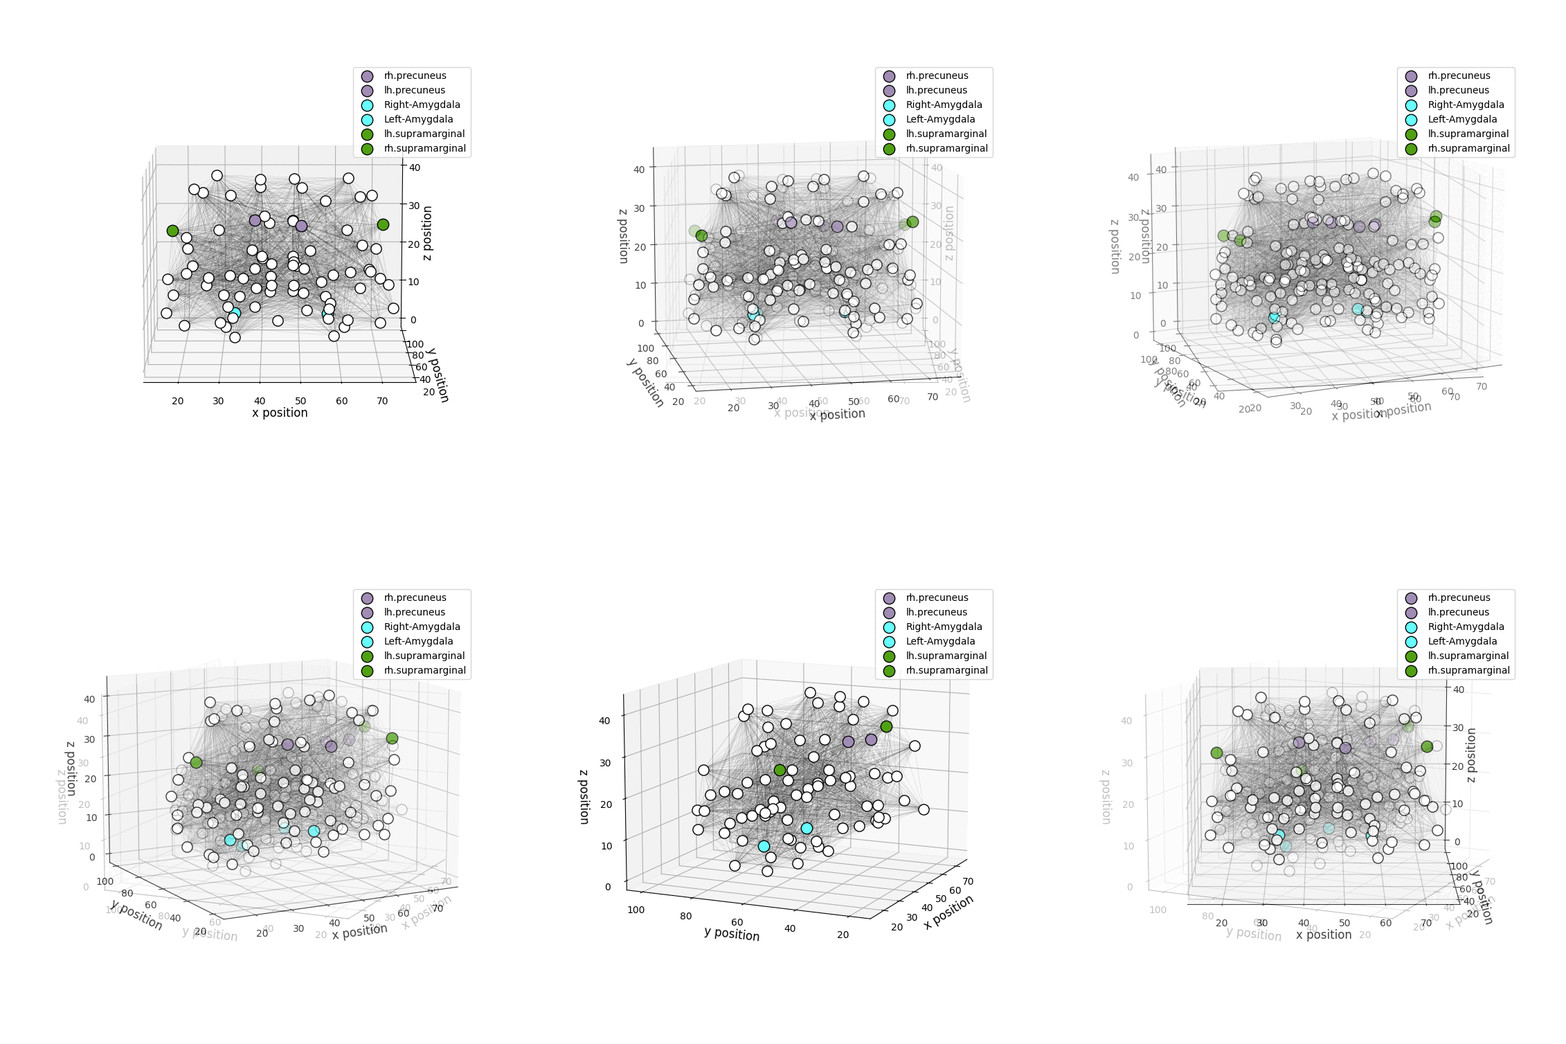
drawConnectome: Simple 3D visualization of the given brain graph. -
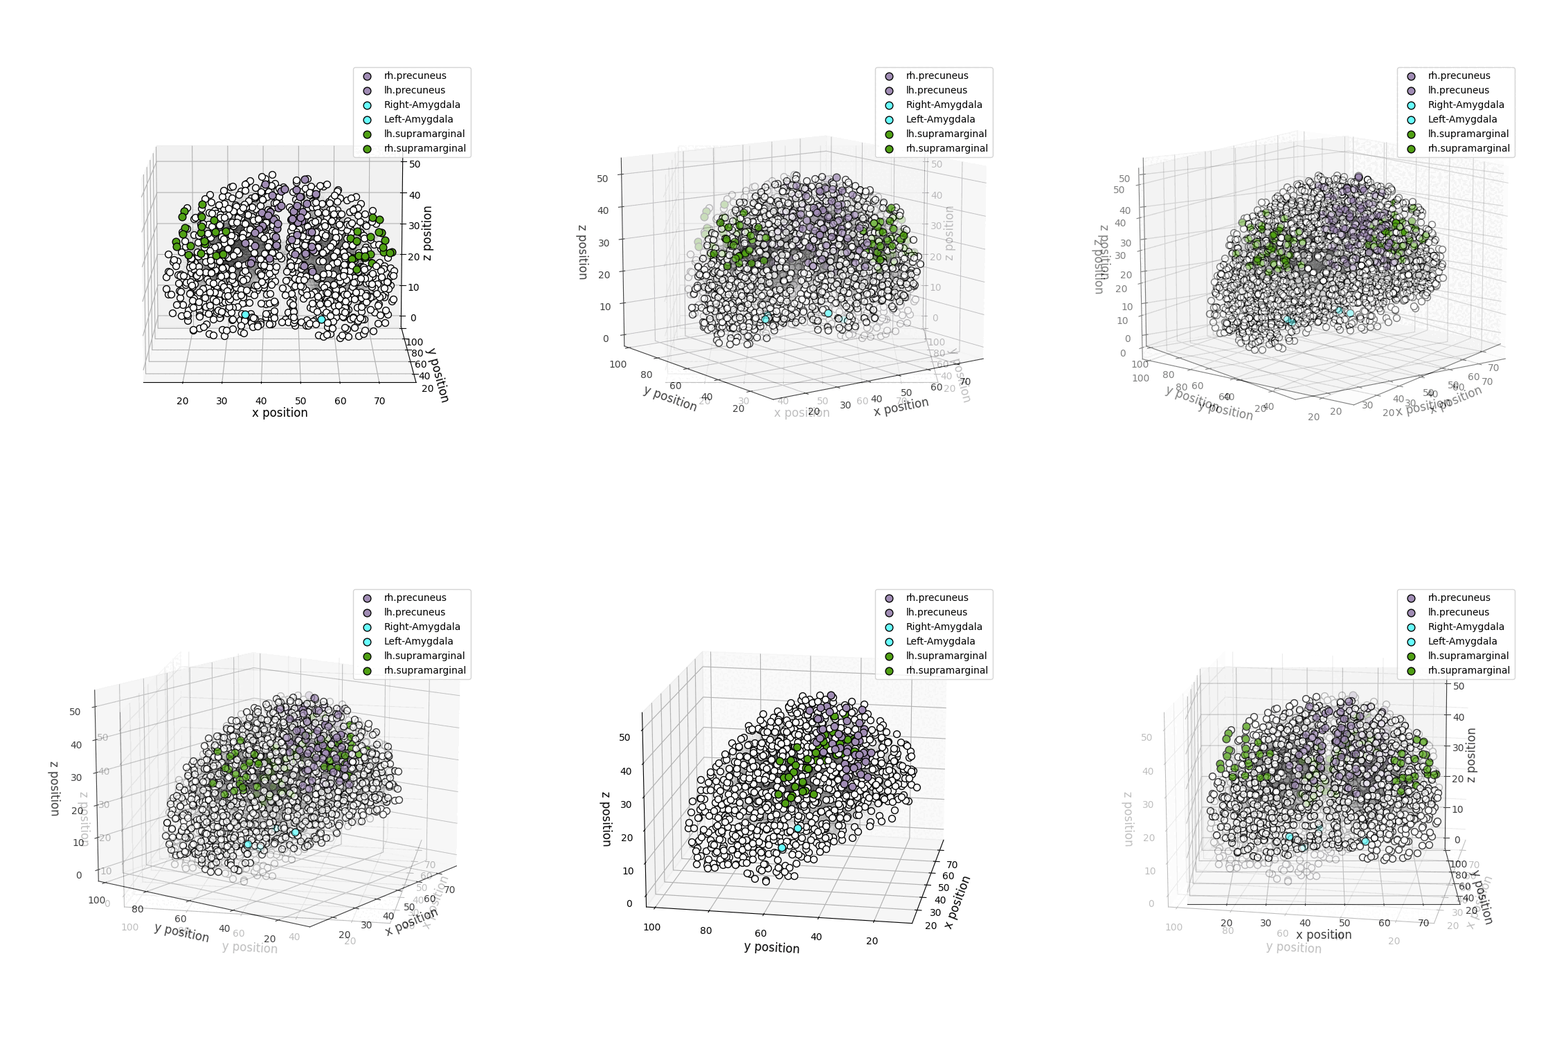
drawRegions: 3D brain graph visualization highlighting the specified regions. The colors used for the regions is the FreeSurfer colormap. -
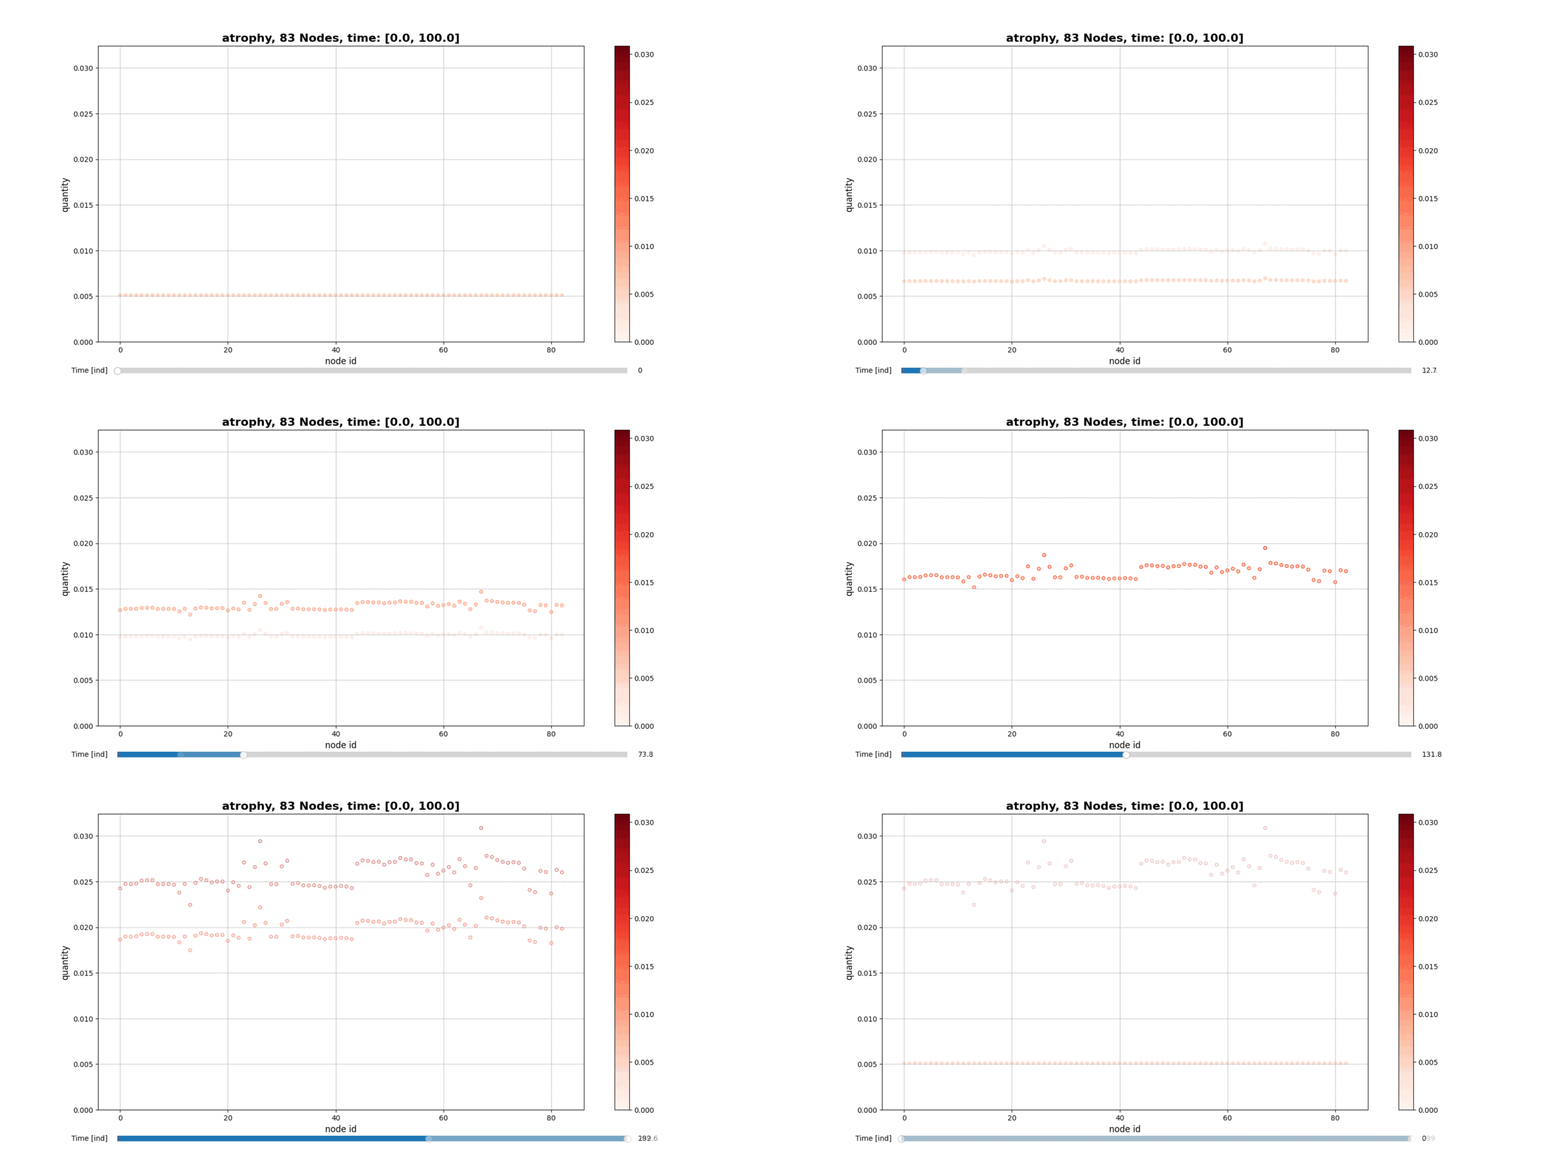
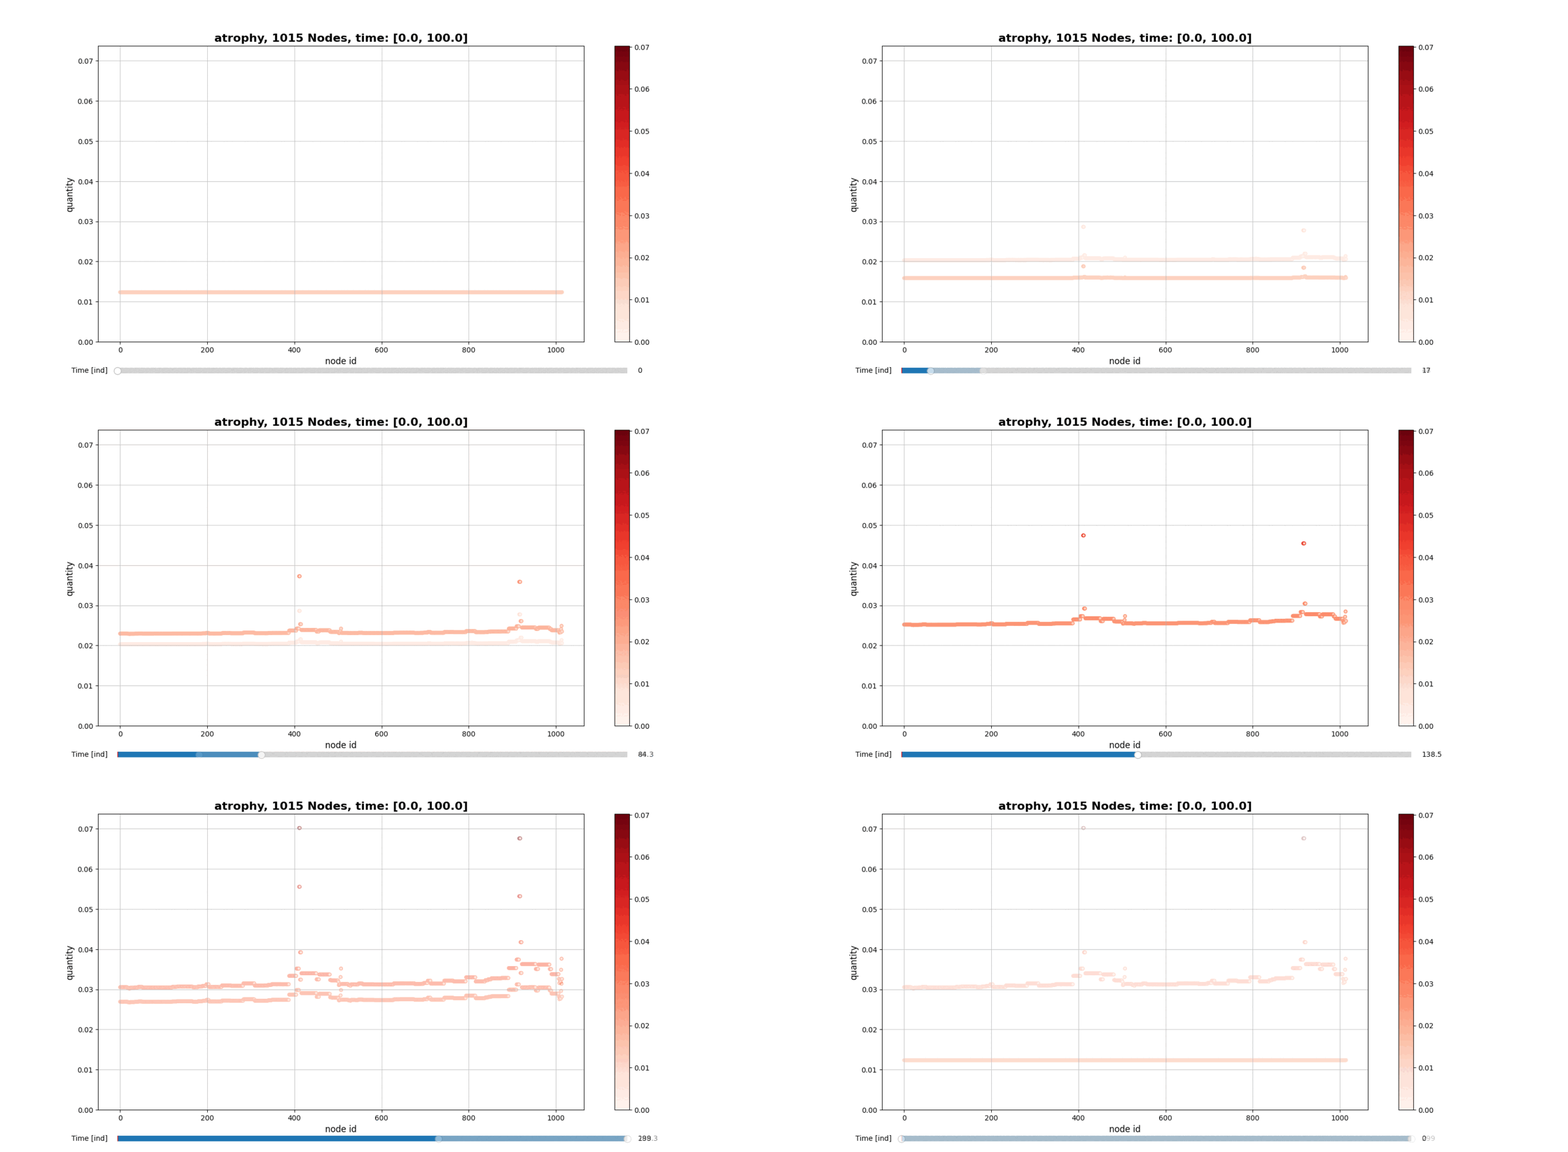
drawConnectomeQuantity: Plot the specified quantity on the nodes in the brain graph over the time range stored into Connectometimeattribute. It provides a slider to go through all the time steps. -
draw_f: Visualization of the surface f. More details in the PAPER.. -
visualizeAvgQuantities: Plot the time evolution of the biological quantities u1, u2, u3 and w, averaged over all the nodes. -
alzheimerModelSimulation: Performs the complete analysis using the new analytical model describing the development of the Alzheimer's Diseases and saves the result into the instantiated Connectome object.
Grid3D Methods
-
FindPointInGrid: Give one or more points to be found in the grid and it returns cellIndexes, gridCoordinates, cellsWithElements. The first one is the ordered list of the cells indexes (i,j,k) containing the points, the second is the list of (x,y,z) coordinates of the cells and the last one is a dictionary with cells indexes as keys and point IDs contained in that cell as values. -
ShowPointsInGrid: 3D visualization of the grid and the points in it. The cells containing the points are displayed in red with increasing alpha as the number of points inside increases, and in green the empty cells.
Citing
If OpenConectome was utilized in your research, we kindly request that you consider citing us in the following manner:
@software{OpenConnectome,
  author       = {S. Bianchi, G. Landi, M. C. Tesi, C. Testa},
  title        = {OpenConnectome, a Brain Graph Analysis tool.},
  year         = 2023,
  url          = {https://github.com/Stefano314/OpenConnectome}
}
Bibliography
- M. Bertscha, B. Franchi, V. Meschini, M. C. Tesi, A. Tosin. "A sensitivity analysis of a mathematical model for the synergistic interplay of amyloid beta and tau on the dynamics of Alzheimer’s disease", Brain Multiphysics Volume 2, 2021, 100020.
Project details
Release history Release notifications | RSS feed
Download files
Download the file for your platform. If you're not sure which to choose, learn more about installing packages.
Source Distribution
Built Distribution
Filter files by name, interpreter, ABI, and platform.
If you're not sure about the file name format, learn more about wheel file names.
Copy a direct link to the current filters
File details
Details for the file openconnectome-0.0.11.tar.gz.
File metadata
- Download URL: openconnectome-0.0.11.tar.gz
- Upload date:
- Size: 23.0 kB
- Tags: Source
- Uploaded using Trusted Publishing? No
- Uploaded via: twine/4.0.2 CPython/3.10.6
File hashes
| Algorithm | Hash digest | |
|---|---|---|
| SHA256 |
1944da7573030e5a4a3626bc7a6dae883066ef069f4a6a57d3208a7e20ee92da
|
|
| MD5 |
8ee97486acd97c1e9fc793c3aa9becbb
|
|
| BLAKE2b-256 |
6ceab6a18837e638843543b1c61627c75e185ad652251a7e8bd380a124ecfd2d
|
File details
Details for the file openconnectome-0.0.11-py3-none-any.whl.
File metadata
- Download URL: openconnectome-0.0.11-py3-none-any.whl
- Upload date:
- Size: 23.4 kB
- Tags: Python 3
- Uploaded using Trusted Publishing? No
- Uploaded via: twine/4.0.2 CPython/3.10.6
File hashes
| Algorithm | Hash digest | |
|---|---|---|
| SHA256 |
d9f40e26a1848b70dfab818240afb1ecdfa3c0a1f888802e14fd00f0ff76ea07
|
|
| MD5 |
37cc457f3a6f455807e4396a7d4a9799
|
|
| BLAKE2b-256 |
43c789581263cbd42e91e1e1485d74e927ecb241223d1265fe3266c68123cac8
|


