Plot the isotopes present during depletion steps.


Project description


Extends OpenMC to provides convenient plotting methods. This is done by Monkey Patching OpenMC to provide additional functionality to the base classes. One benefit of this is the user can continue to work with the familiar OpenMC classes and they simply get additional functionality. Another benefit is that if any of these functions ever become popular enough to include in OpenMC then it could be done with a simple copy paste into the existing class structure. Plotly figures or MatPlotLib figures are returned for user customization.
:point_right: API Examples
Install
The full openmc_depletion_plotter package can be installed from PyPi with the terminal command.
pip install openmc_depletion_plotter[gui]
Or without the Graphical User Interface
pip install openmc_depletion_plotter
Graphical User Interface
Once installed you can then used the API or launch the GUI. To launch the GUI type the following command in the terminal and the browser should open with the GUI.
openmc_depletion_plotter
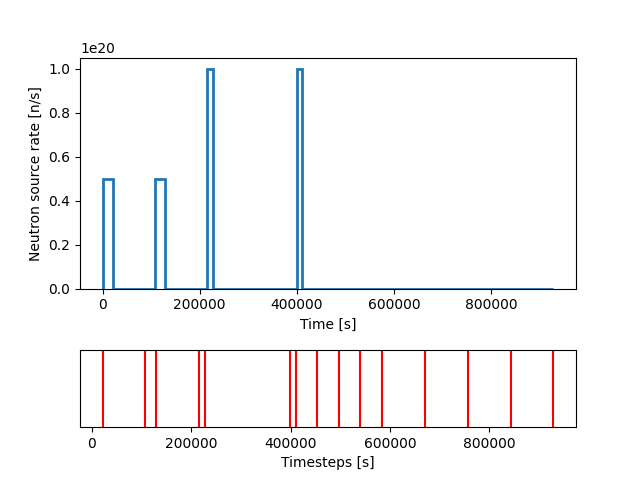
Plotting pulse schedule
All the Integrator classes have been extended to include a .plot_pulse_schedule() method.
This method plots the source rate as a function of time.
This is useful when wanting to visually display a pulse schedule used in an depletion / activation study.
Additional methods provided
openmc.deplete.PredictorIntegrator.plot_pulse_schedule()
openmc.deplete.CECMIntegrator.plot_pulse_schedule()
openmc.deplete.CF4Integrator.plot_pulse_schedule()
openmc.deplete.CELIIntegrator.plot_pulse_schedule()
openmc.deplete.EPCRK4Integrator.plot_pulse_schedule()
openmc.deplete.LEQIIntegrator.plot_pulse_schedule()
openmc.deplete.SICELIIntegrator.plot_pulse_schedule()
openmc.deplete.SILEQIIntegrator.plot_pulse_schedule()
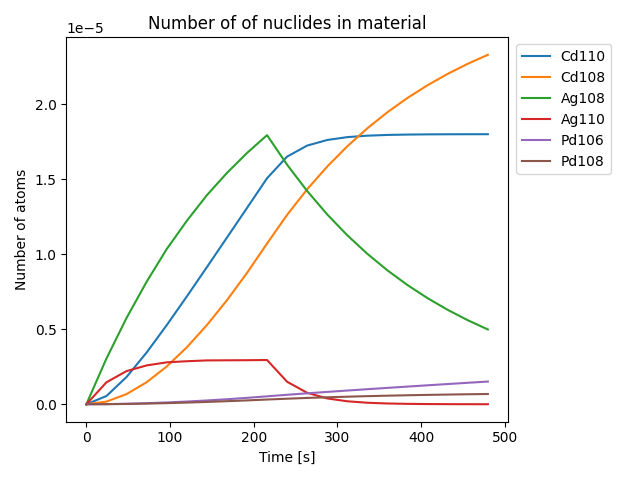
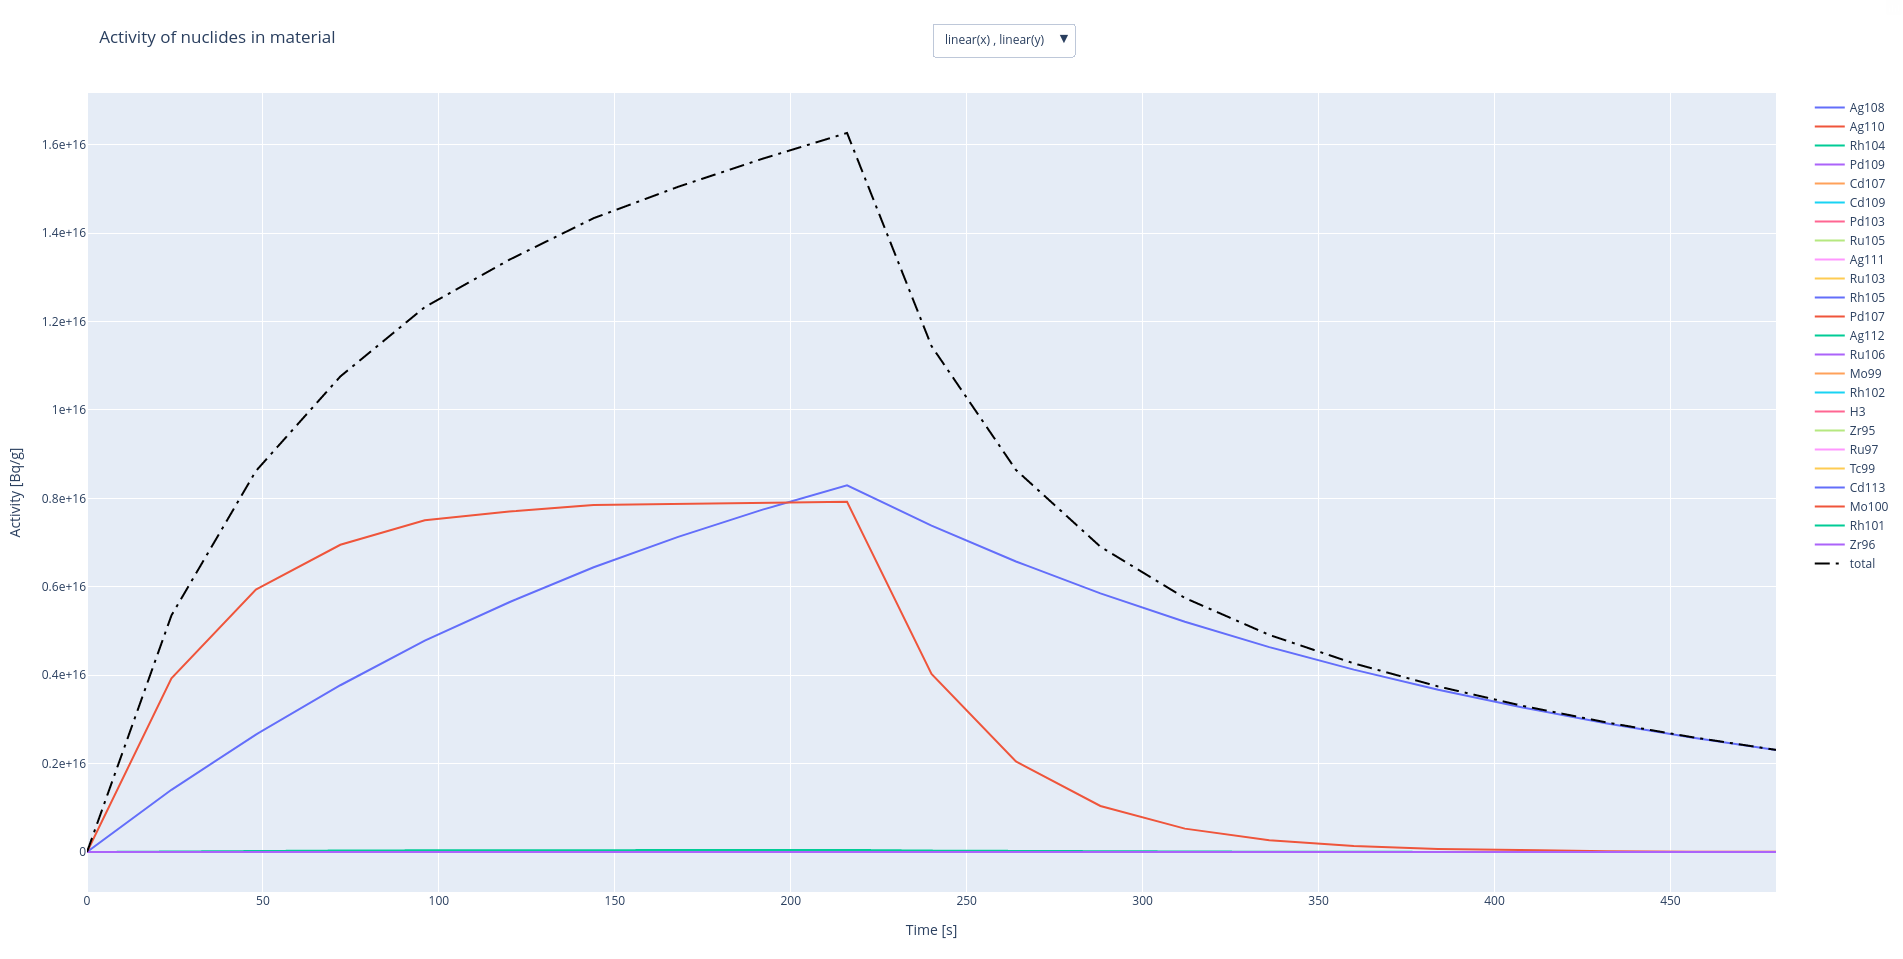
Plotting activation, atoms, or decay heat as a function of time
The openmc.deplete.Results() class has been extended to include a plot_atoms_vs_time() method and a plot_activity_vs_time method.
These methods plot atoms or activity as a function of time. These plots optionally include a breakdown of the dominant nuclides. Matplotlib or Plotly backends are available.
Additional methods provided
openmc.deplete.Results.plot_atoms_vs_time()
openmc.deplete.Results.plot_activity_vs_time()
openmc.deplete.Results.plot_decay_heat_vs_time()
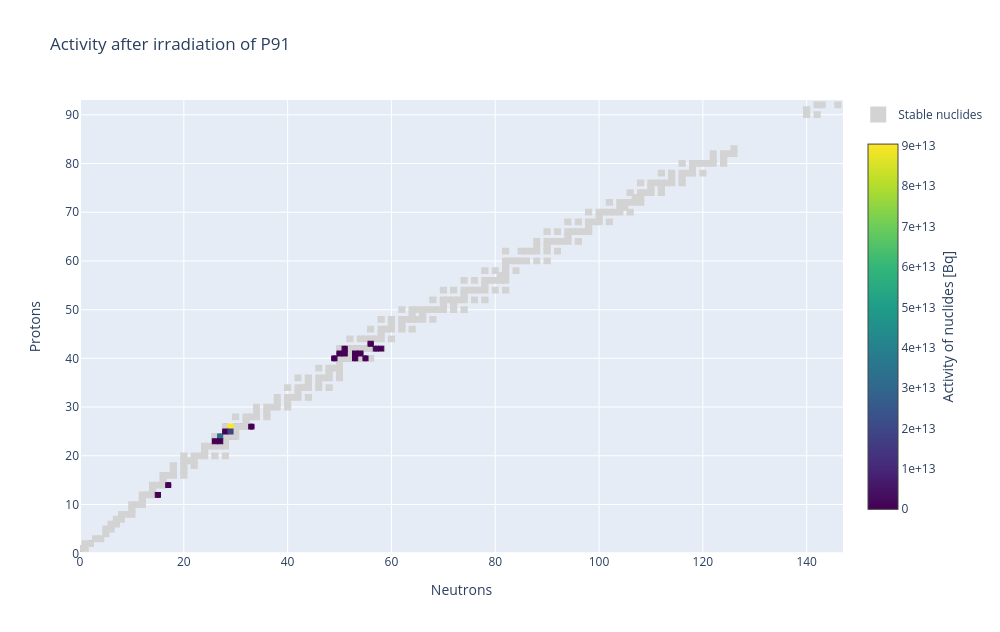
Plotting activation or atoms on an isotope chart
The openmc.Material() class has been extended to include a plot_isotope_chart_of_activity() method and plot_isotope_chart_of_atoms() method.
This method plots the material atoms or the material activity on an isotope chart.
I started making isotope plots back in 2010 so nice to finally distribute this :smile:
Additional methods provided
openmc.Material.plot_isotope_chart_of_atoms()
openmc.Material.plot_isotope_chart_of_activity()
Release history Release notifications | RSS feed


Download files
Download the file for your platform. If you're not sure which to choose, learn more about installing packages.
Source Distribution
Built Distribution
Filter files by name, interpreter, ABI, and platform.
If you're not sure about the file name format, learn more about wheel file names.
Copy a direct link to the current filters
File details
Details for the file openmc_depletion_plotter-0.4.2.tar.gz.
File metadata
- Download URL: openmc_depletion_plotter-0.4.2.tar.gz
- Upload date:
- Size: 37.1 MB
- Tags: Source
- Uploaded using Trusted Publishing? No
- Uploaded via: twine/6.1.0 CPython/3.13.2
File hashes
| Algorithm | Hash digest | |
|---|---|---|
| SHA256 |
0793b49d9ae2f1eba2453e6c7169d938990ac0d904f5d44cbffbe9e06598e035
|
|
| MD5 |
9307c14f59a6c4aa7ac808448621f616
|
|
| BLAKE2b-256 |
fca6054ac6e0cf6e7c4d0003e957bee85c425847874de459166127dea83bc97a
|
File details
Details for the file openmc_depletion_plotter-0.4.2-py3-none-any.whl.
File metadata
- Download URL: openmc_depletion_plotter-0.4.2-py3-none-any.whl
- Upload date:
- Size: 16.6 kB
- Tags: Python 3
- Uploaded using Trusted Publishing? No
- Uploaded via: twine/6.1.0 CPython/3.13.2
File hashes
| Algorithm | Hash digest | |
|---|---|---|
| SHA256 |
249b20d617a7931326a14bf4d47016f3ee90a573a8e7834624a6583283f7e95a
|
|
| MD5 |
bd86fe431b9594cb7d193edeff3c3930
|
|
| BLAKE2b-256 |
323eb07446e1d48fe0e3ed4d07382493fbd98bb51c2673173cbcadf6c9eca545
|


