A PyPI package to compute multivariate tensor-based orthogonal polynomials for sequence data and map phenotypes onto sequence space.

Project description
ortho_seqs
Ortho_seqs is a command line to convert sequence data (DNA/protein) to tensor-valued orthogonal polynomials and project phenotypes onto the polynomial space. We do this by first converting the sequence information into 4-dimensional (for DNA) or 20-dimensional (for amino acids) vectors. The method can also be used for padded sequences to deal with unequal sequence lengths. Find out more about the approach in this paper Analyzing genomic data using tensor-based orthogonal polynomials with application to synthetic RNAs. The paper gives an example of this method as applied to a case of synthetic RNA from a previously published dataset. Another manuscript detailing the use of this method to understand binding affinities of transcription factors (TFs) is currently in progress.
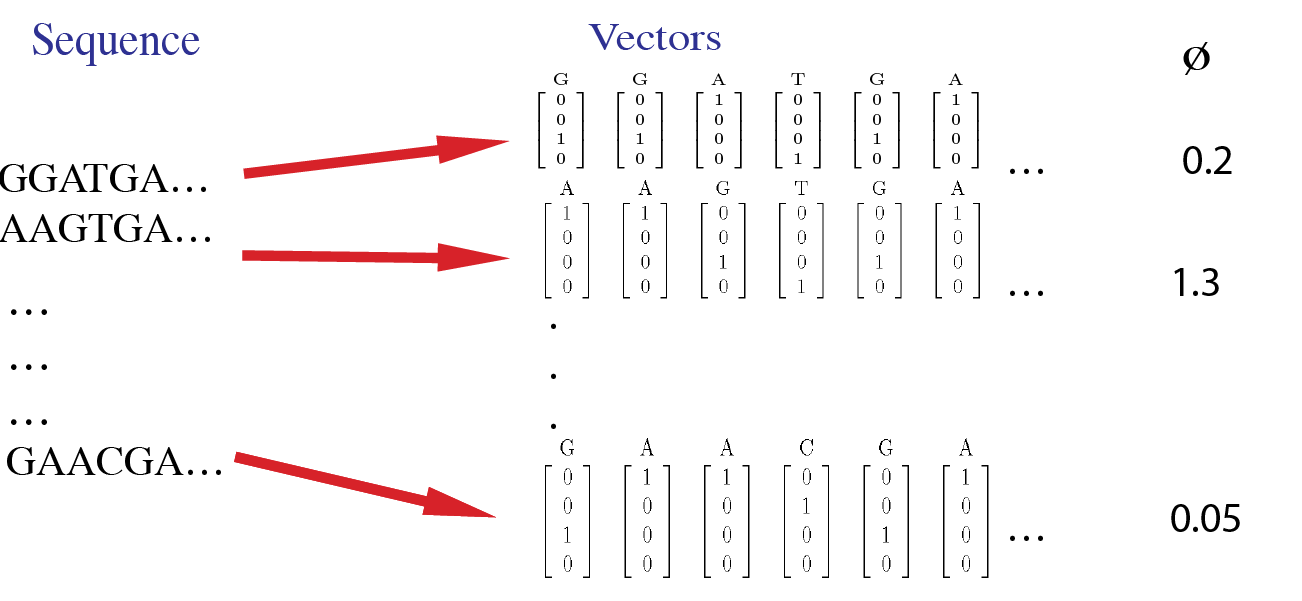
For example, the sample data inputs for this tool are shown in this image. Here, each site in a sequence is first converted to a 4-dimensional vector. The input data includes phenotype values for each sequence.
Usage
First, install an environment with dependencies for this package:
conda create -n ortho_seqs pip
pip install -r requirements.txt
conda activate ortho_seq
or
conda env create -f conda_environment.yml
conda activate ortho_seq
Then, install the package:
python setup.py install
Gather the input files needed.
- You'll have one file with sequence data as seen in the first column in the image above (.txt or .dat or .csv). See repo's data folder for examples of what these look like for DNA or proteins.
- You'll have one file with corresponding phenotypes as seen in the last column in the image above (.txt or .dat or .csv) with the same length as the number of sequences. Phenotypes here are defined as real numbers.
Then, to run the commandline tool:
To start with a test example, you can run the sample command below::
ortho_seq orthogonal-polynomial ./ortho_seq_code/tests/data/nucleotide/first_order/test_seqs_2sites_dna.txt --pop_size 12 --dm 4 --sites 2 --molecule DNA --pheno_file ./ortho_seq_code/tests/data/nucleotide/first_order/trait_test_seqs_2sites_dna.txt --poly_order second --out_dir ../results_ortho_seq_testing/DNA_2sites_test_run/
The above sample command line is building the tensor-valued orthogonal polynomial space based on the sequence data which consists of 12 sequences, each with two sites. Since these are DNA sequences, the vectors are 4-dimensional. Corresponding to each sequence is a phenotype value (a real number) as given in the phenotype file. For DNA, the tool can run first and second order analyses currently. We'll implement third order in a future version. For amino acids, the current version supports first order analysis and we hope to expand this in the future. Along with regressions on each site independent of one another and onto two sites at a time, the above command also computes Fest which is the phenotype estimated by the regressions. This shows that the mathematical calculations are done correctly as we now have an equation that accurately captures our initial data points. This only works here for sequences with 2 sites. If we had more sites, we'd need to do higher order calculations in order to capture all our combinations. Therefore, when runing the tool with more sites, as will probably be the case for most users, even just going up to second order gives us useful information about our system. First order tells us the importance of each site (independent of any correlations it might have with another site) and second order tells the importance of pairs of nucleotides independent of other pairs. Please take a look at the paper linked above to learn more about this method.
Flags & Functionality
--pheno_file
Input a file with phenotype values corresponding to each sequence in the sequence file.
--molecule
Currently, you can provide DNA or protein sequences.
--sites
The number of sites in a sequence. If you have sequences with unequal lengths, please pad them with a lowercase 'n'. See examples in the ortho_seq_code/tests/ folder.
--dm
The dimension of the vector corresponding to a site along a sequence. This is 4 for DNA and 20 for protein. For protein, you can provide a dimension of 21 in the case that you have padded protein sequences. See test data in the repo for examples.
--pop_size
The number of total sequences.
--poly_order
The order of the polynomials that will be constructed. Currently, one can do first and second order for DNA and first order for protein.
--out_dir
Directory where results can be stored.
--precomputed
Let's say you have a case where you have the same set of sequences but two different corresponding sets of phenotypes. You can build your sequence space and then project the first set of phenotypes onto this space. Then, if you wish to see how the other set of phenotypes maps onto the same sequence space, you can use this flag so that you're not wasting time and memory to recompute the space. When doing this, be sure to add your results from the first run to the out_dir when rerunning the command with the precomputed flag.
Results & Outputs
The tool will provide udpates as the run is progressing regarding which parts of the calculations are done being computed. For example, when the mean is computed, it'll say "computed mean". All the different elements that it is computing are different parts of building the multivariate tensor-valued orthogonal polynomial space based on the sequence information. To get a general idea of what the calculations mean, please refer to the supplementary methods in the paper linked above. The program will save outputs in npz format. See below for what is stored.
{sequence_file_name}.npz
This will store the calculations that went into constructing the polynomial space. This also includes information about the statics of our sequence space, such as mean, variance and a matrix of covariances. See figures 4 and for ideas on how mean and the matrix of covariances can be visualized. All of these calculations go into building the orthogonal polynomial space based on sequence information and at this point of the program, we have not connected the phenotype (the functional variable) with the sequence information.
{sequence_file_name}_covs_with_F.npz
This will store the covariance of the phenotype (or trait) with the polynomials. This is when we start connecting the phenotype with the sequence space.
{trait_file_name}_Fm.npz
This contains the mean trait value. This is a scalar.
{trait_file_name}_regressions.npz
This set of files contains the main results which includes the following:
- rFon1D: This is the regression of the trait onto the first order conditional polynomial orthogonalized within. This tells us the regression of the phenotype onto each site and onto each nucleotide (or amino acid) at that site independent of any correlations that site might have with other sites. For the case of nucleotides, this can be visualized as bar plots as shown in Figure 6 in the paper linked above.
- rFon2D: This gives 4 matrices which give the regression of the pheonotype onto (site1)x(site1), (site 1)x(site 2), (site 2)x(site 1) and (site 2)x(site 2), in that order. The second matrix here is the important one and it is the same as rFon12. See description of rFon12.
- rFon12: This is the regression of the trait onto pairs of sites for given nucleotides at each site. These are regressions on (site 1)x(site 2) independent of first order associations. Since we're looking at 2 sites at a time and there's a possibility of having 4 nucleotides at each site (for the case of DNA), we can visualize this via a 4x4 matrix as shown in Figure 8 in the paper linked above.
Support
If you have specific or general questions, feel free to open an issue and we'll do our best to address them. If you have any comments, suggestions or would like to chat about this method or similar ideas, feel free to reach out via email at saba.nafees314@gmail.com.
Roadmap
We hope to implement third order analysis for DNA in the near future. For amino acids, we hope to implement second order analysis. We'll add visualization ideas soon but if you have any thoughts on this, please feel free to reach out.
Contribution
We hope to make the tool run faster as with higher dimenions and higher order analysis of longer sequence data, we can run into memory and time issues. Any thoughts on this or visualization are welcome.
Authors and acknowledgements
The derivation of the method and the construction of an initial version of the program was done by Dr. Sean Rice who served as Saba's Ph.D. advisor. Thank you to Isaac Griswold-Steiner for helping write the function to compute generalized inner and outer products. Thank you to Pranathi Vemuri for helping with the very initial draft of the CLI, adding CI integration testing, and to Phoenix Logan for helping write unit-tests. Thank you to Vijayanta Jain and Saugato Rahman Dhruba for being the guinea pigs and running lots of sample commands, discussing the mathematics with me, and for their ideas on visualizations. Their efforts are deeply appreciated!
License
Release history Release notifications | RSS feed


Download files
Download the file for your platform. If you're not sure which to choose, learn more about installing packages.
Source Distribution
File details
Details for the file ortho_seq_code-1.0.1.tar.gz.
File metadata
- Download URL: ortho_seq_code-1.0.1.tar.gz
- Upload date:
- Size: 18.2 kB
- Tags: Source
- Uploaded using Trusted Publishing? No
- Uploaded via: twine/3.4.1 importlib_metadata/3.7.3 pkginfo/1.7.0 requests/2.25.1 requests-toolbelt/0.9.1 tqdm/4.59.0 CPython/3.8.5
File hashes
| Algorithm | Hash digest | |
|---|---|---|
| SHA256 |
5700c817aa88cf1cd968c156ac0571c1acbc7ff87a5a24263d154210d8b40769
|
|
| MD5 |
d2d7e08c6534fb1a223537081482af23
|
|
| BLAKE2b-256 |
7c76b65508c160fc30993063ea506b7bbfd290c915d79b31521a002ef9ee670e
|


