
add zoom indicators, insets, and magnified panels to matplotlib/seaborn visualizations with ease!

Project description

outset wordmark

PyPi docs GitHub stars CI Deploy Sphinx documentation to Pages zenodo

add zoom indicators, insets, and magnified panels to matplotlib/seaborn visualizations with ease!

Features

  • compose axes grids to juxtapose a complete plot with data subsets or magnified subregions

  • render grid axes as overlaid insets

  • draw elegant zoom indicators with publication-ready default styling

  • enjoy a familiar, data-oriented interface — with full feature sets inherited directly from seaborn

  • abstract away handling of padding and aspect ratios

  • fine-tune appearance and layout with extensive styling options and bundled numbering/symbol library

  • use hooks to inject custom functionality, like numbering/symbols and layout tweaks

Install

python3 -m pip install outset

Basic Usage

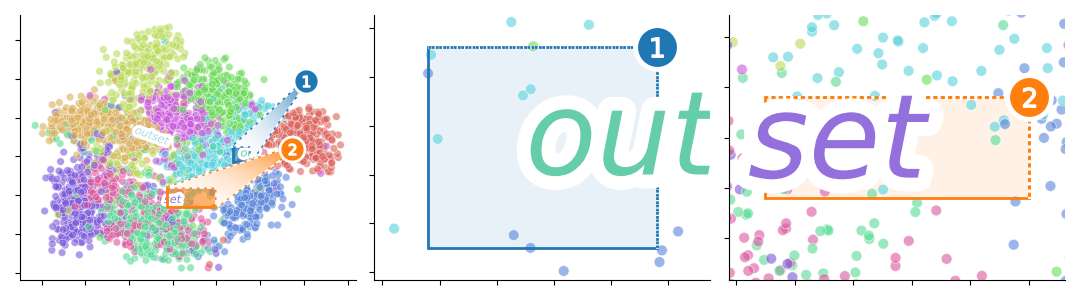
Use outset.OutsetGrid to compose source plot with zoom panels on an axes grid. Zoom sections can be a) designated manually or b) inferred to bound data subsets. To overlay zoom panels onto source plot, c) call outset.inset_outsets.

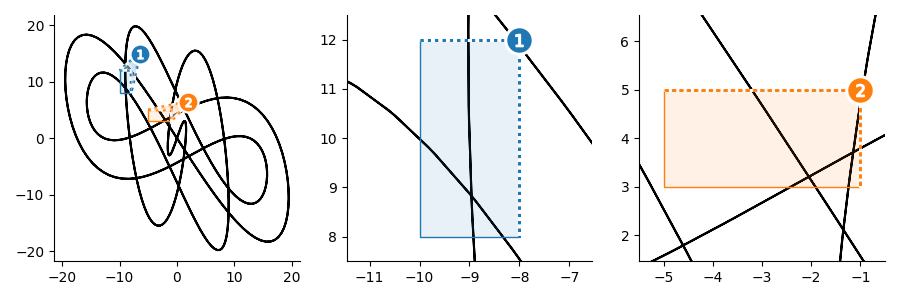
a) Create OutsetGrid, Explicit Zoom Areas

from matplotlib import pyplot as plt
import numpy as np
import outset as otst
import seaborn as sns
# adapted from # https://matplotlib.org/stable/gallery/
i, a, b, c, d = np.arange(0.0, 2*np.pi, 0.01), 1, 7, 3, 11

# 3 axes grid: source plot and two zoom frames
grid = otst.OutsetGrid([(-10, 8, -8, 12), (-5, 5, -1, 3)])  # frame coords
grid.broadcast(plt.plot,  # run plotter over all axes
   np.sin(i*a)*np.cos(i*b) * 20, np.sin(i*c)*np.cos(i*d) * 20,  # line coords
   c="k", zorder=-1)  # kwargs forwarded to plt.plot

grid.marqueeplot()  # set axlims and render marquee annotations
usage example 1 result

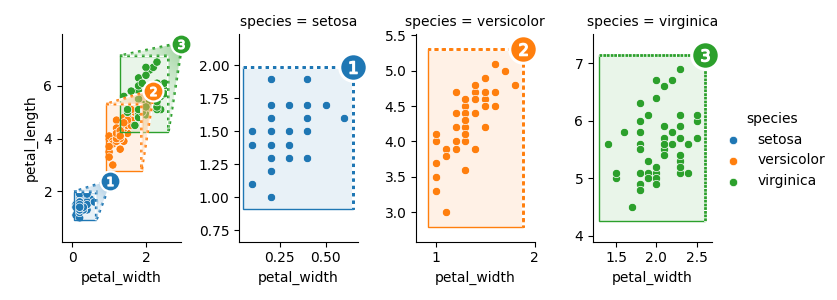
b) Create OutsetGrid, Inferred Zoom Areas

grid = otst.OutsetGrid(data=sns.load_dataset("iris").dropna(),  # facet over axes grid
   x="petal_width", y="petal_length",
   col="species",  # create zoom panel for each species
   hue="species",  # color marquee annotations by species
   aspect=0.6, height=3)  # adjust axes grid geometry
grid.map_dataframe(sns.scatterplot,  # map plotter over faceted data
   x="petal_width", y="petal_length", legend=False, zorder=0)

grid.marqueeplot()   # set axlims and render marquee annotations
grid.add_legend()  # add figure-level legend
usage example 2 result

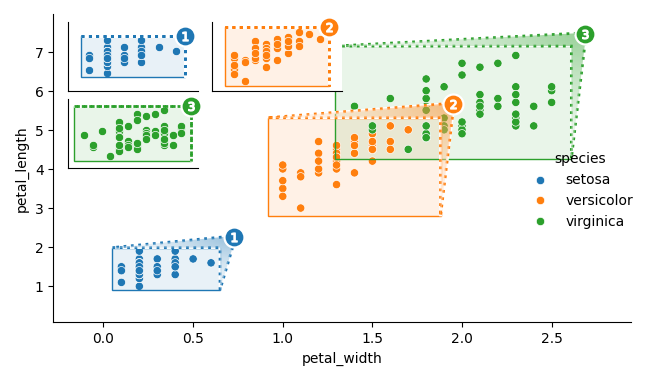
c) Overlay Zoom Panels as Insets

grid = otst.OutsetGrid(data=sns.load_dataset("iris").dropna(),  # facet over axes grid
   x="petal_width", y="petal_length",
   col="species",  # put each species in its own outset
   hue="species",   # make different color marquees
   aspect=1.5, height=4)  # adjust axes grid geometry
grid.map_dataframe(sns.scatterplot,  # map plotter over faceted data
   x="petal_width", y="petal_length", legend=False, zorder=0)

grid.add_legend()  # add figure-level legend
otst.inset_outsets(grid, insets="NW")  # inset outsets in upper-left corner
grid.marqueeplot()  # set axlims and render marquee annotations
usage example 3 result

See the quickstart guide for more detailed usage information.

API Overview

  • outset.OutsetGrid: compose a source plot and zoom regions over it (e.g., “outsets”) on a multiplot lattice

    • designate zoom regions directly, or as regions containing data subsets

    • object-oriented, “tidy data” interface a la seaborn.FacetGrid

  • outset.inset_outsets: rearrange an OutsetGrid to place outset zoom regions as insets over the original source axes

  • outset.marqueeplot: axis-level “tidy data” interface to draw marquees framing specified subsets of data

  • outset.draw_marquee: low-level interface to draw individual marquee annotations

Read the full API documentation here.

Available Styling Extensions

Callout mark glyphs: customize marquee identifiers; pass as mark_glyph kwarg

outset.mark.MarkAlphabeticalBadges | outset.mark.MarkArrow | outset.mark.MarkInlaidAsterisk | outset.mark.MarkMagnifyingGlass | outset.mark.MarkRomanBadges

comparison of available glyphs

These mark glyphs can also be used directly, independently of the rest of the library!

Callout tweaks: customize how marquee callouts are shaped and positioned; pass as leader_tweak kwarg

Citation

If outset is used in scientific publication, please cite it as

Matthew Andres Moreno. (2023). mmore500/outset. Zenodo. https://doi.org/10.5281/zenodo.10426106

@software{moreno2023outset,
  author = {Matthew Andres Moreno},
  title = {mmore500/outset},
  month = dec,
  year = 2023,
  publisher = {Zenodo},
  doi = {10.5281/zenodo.10426106},
  url = {https://doi.org/10.5281/zenodo.10426106}
}

Consider also citing matplotlib and seaborn . And don’t forget to leave a star on GitHub!

Contributing

This project welcomes contributions and suggestions. Documentation includes detailed information to get you started.

Project details


Release history Release notifications | RSS feed

Download files

Download the file for your platform. If you're not sure which to choose, learn more about installing packages.

Source Distribution

outset-0.1.9.tar.gz (5.8 MB view hashes)

Uploaded Source

Built Distribution

outset-0.1.9-py3-none-any.whl (57.9 kB view hashes)

Uploaded Python 3

Supported by

AWS AWS Cloud computing and Security Sponsor Datadog Datadog Monitoring Fastly Fastly CDN Google Google Download Analytics Microsoft Microsoft PSF Sponsor Pingdom Pingdom Monitoring Sentry Sentry Error logging StatusPage StatusPage Status page