Visualize your pandas data with one-line code
Project description
PandasEcharts
简介
基于pandas和pyecharts的可视化工具,该项目的旨在用一行代码可视化您的pandas数据。
安装
pip 安装
$ pip install pandasecharts
源码安装
$ git clone https://github.com/gamersover/pandasecharts
$ cd pandasecharts
$ pip install -r requirements.txt
$ python setup.py install
使用
notebook环境
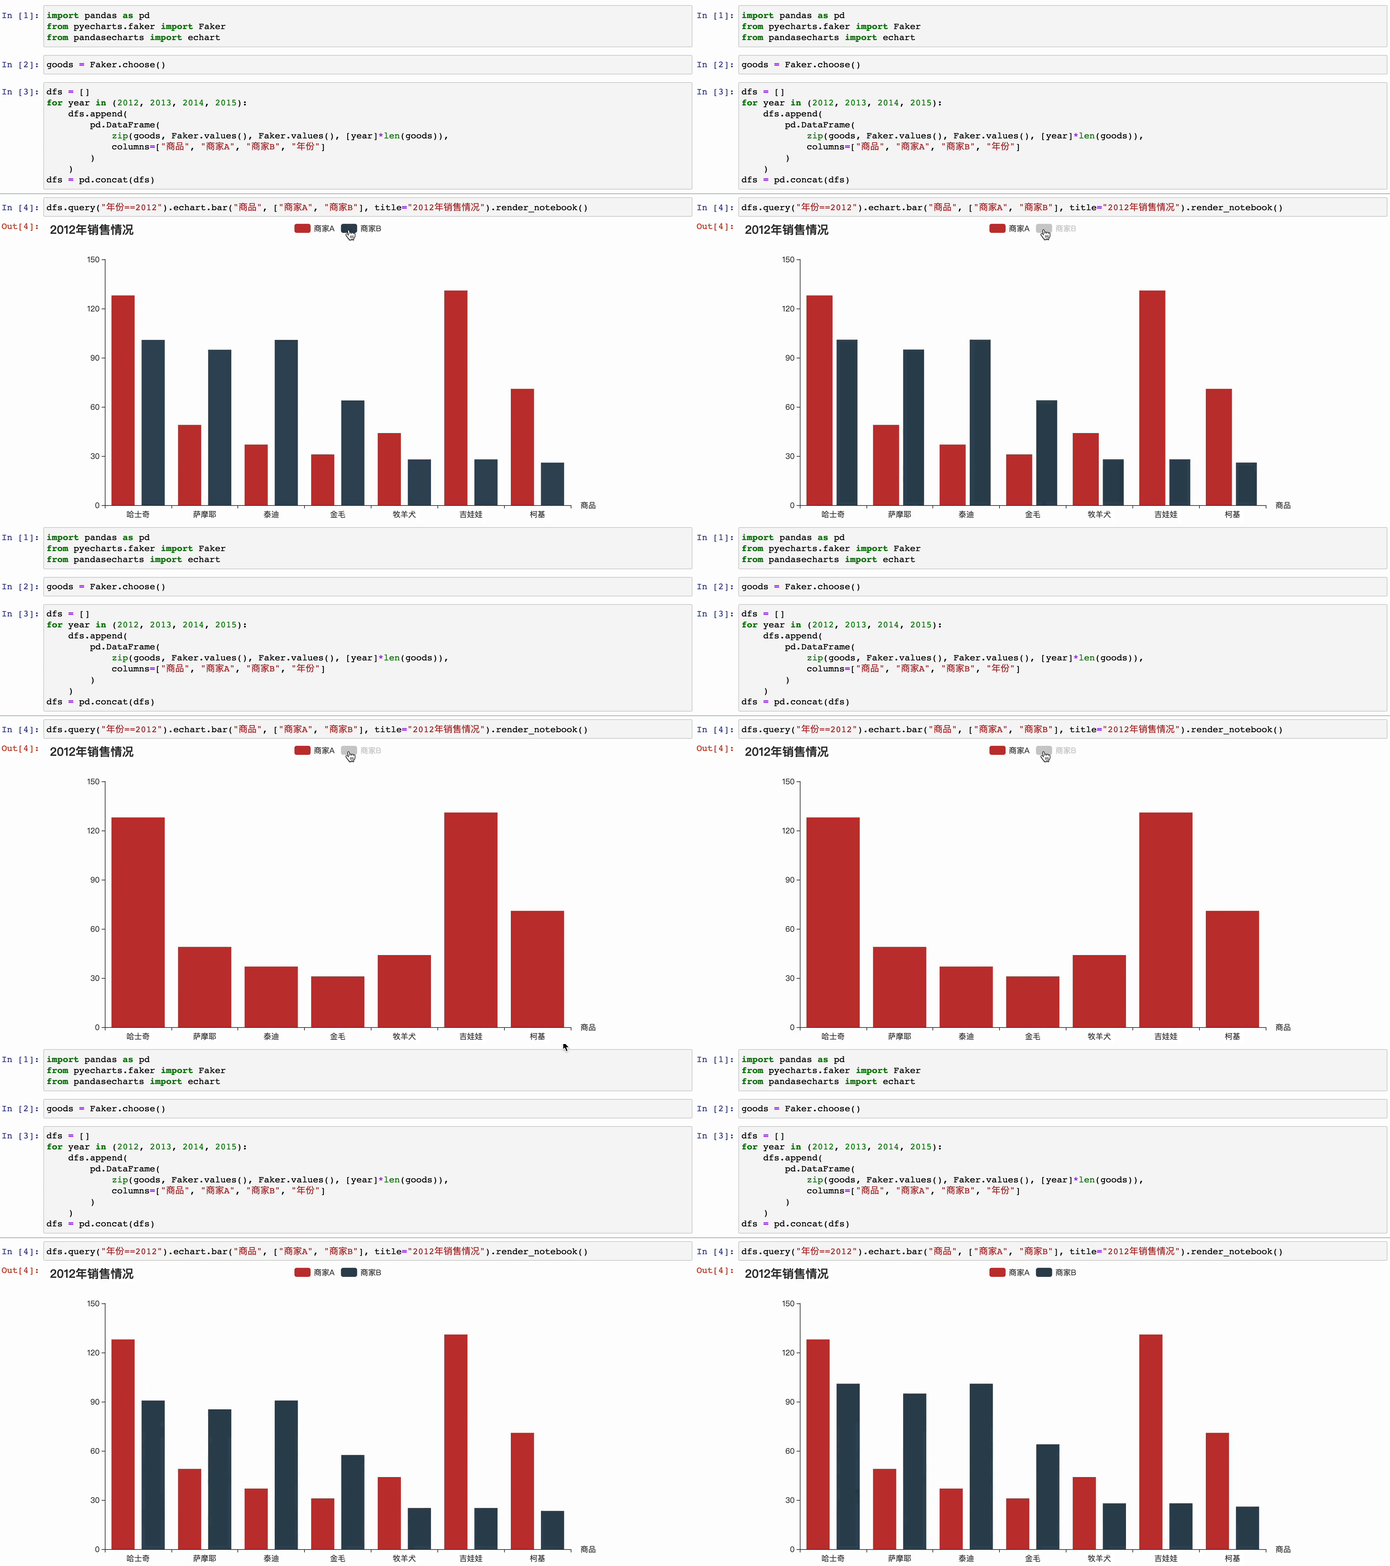
- 基本直方图
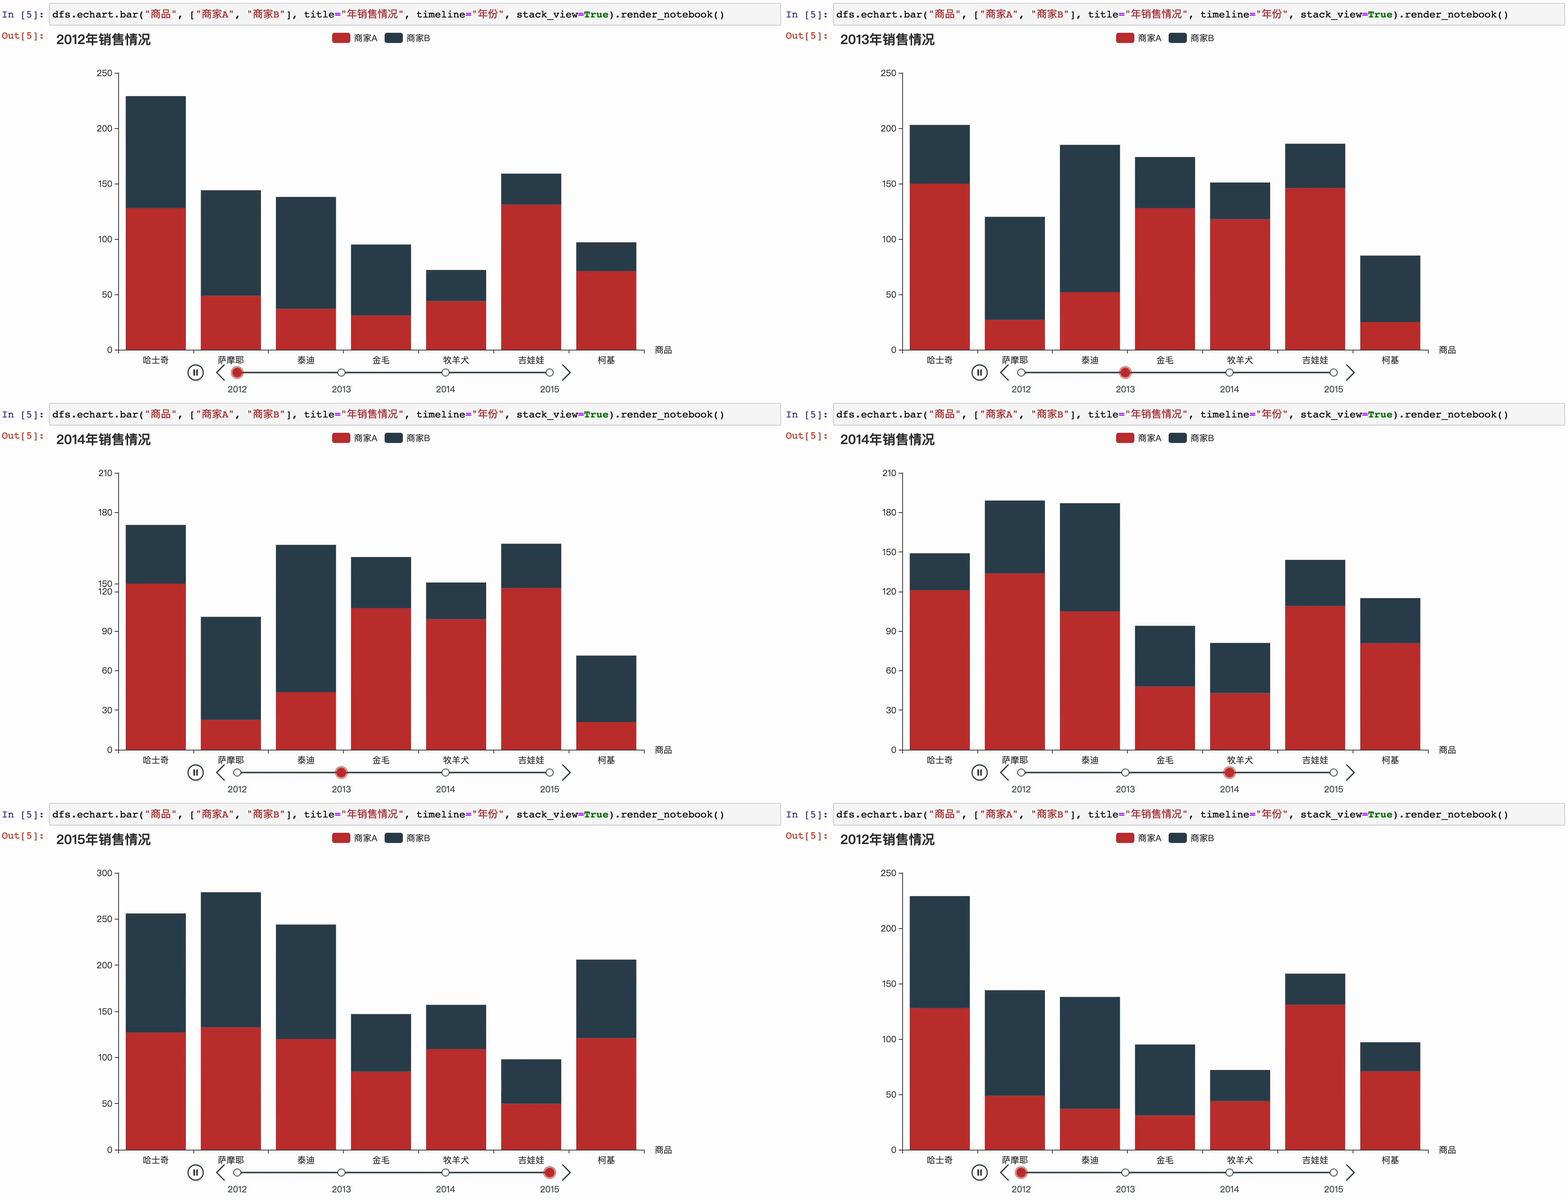
- 带时间变化的直方图
更多使用方法请访问
后续计划
目前已支持图表类型
- Pie
- Bar
- Bar3D
- Line
- Line3D
- Scatter
- Scatter3D
- Boxplot
- Geo
- Map
- Funnel
- Calendar
- WordCloud
0.5版本计划
- 支持代码提示
- 加入datazoom
- 修复line图形当xtype为value时需要排序的问题
License
MIT ©gamersover
Project details
Release history Release notifications | RSS feed
Download files
Download the file for your platform. If you're not sure which to choose, learn more about installing packages.
Source Distribution
pandasecharts-0.5.tar.gz
(18.0 kB
view hashes)
Built Distribution
Close
Hashes for pandasecharts-0.5-py3-none-any.whl
| Algorithm | Hash digest | |
|---|---|---|
| SHA256 | c379a1251b3da988003e3a5246290981023ae5d8a6471eb295746d01b685e764 |
|
| MD5 | 369f29257a7b6104afa605a32c053116 |
|
| BLAKE2b-256 | 9e395ed3716d454f972e7b8efc8c0236e1e97e119c6486ff2f1e34b824bf9d1e |


