
Pareto chart for python (similar to Matlab, but much more flexible).
Features
Data labels for the chart x-axis.
- Fully customizable with unique arg and kwarg inputs:
Bar chart: follows the inputs of the matplotlib.pyplot.bar function (use bar_args=(...) and bar_kw={...}).
Cumulative line: follows the inputs of the matplotlib.pyplot.plot function (use line_args=(...) and line_kw={...}).
Limit line: follows the inputs of the matplotlib.axes.Axes.axhline function (use limit_kw={...}).
Put the chart on arbitrary axes.
Examples
First, a simple import:
from paretochart import pareto
Now, let’s create the numeric data (no pre-sorting necessary):
data = [21, 2, 10, 4, 16]
We can even assign x-axis labels (in the same order as the data):
labels = ['tom', 'betty', 'alyson', 'john', 'bob']
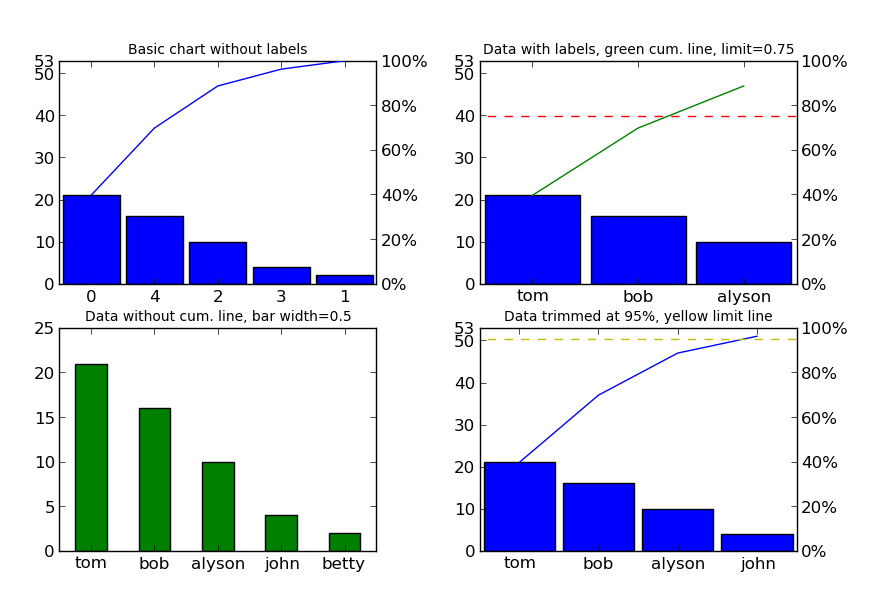
For this example, we’ll create 4 plots that show the customization capabilities:
import matplotlib.pyplot as plt

# create a grid of subplots
fig, axes = plt.subplots(2, 2)
The first plot will be the simplest usage, with just the data:
pareto(data, axes=axes[0, 0])
plt.title('Basic chart without labels', fontsize=10)
In the second plot, we’ll add labels, put a cumulative limit at 0.75 (or 75%) and turn the cumulative line green:
pareto(data, labels, axes=axes[0, 1], limit=0.75, line_args=('g',))
plt.title('Data with labels, green cum. line, limit=0.75', fontsize=10)
In the third plot, we’ll remove the cumulative line and limit line, make the bars green and resize them to a width of 0.5:
pareto(data, labels, cumplot=False, axes=axes[1, 0], data_kw={'width': 0.5,
    'color': 'g'})
plt.title('Data without cum. line, green bar width=0.5', fontsize=10)
In the fourth plot, let’s put the cumulative limit at 95% and make that line yellow:
pareto(data, labels, limit=0.95, axes=axes[1, 1], limit_kw={'color': 'y'})
plt.title('Data trimmed at 95%, yellow limit line', fontsize=10)
And last, but not least, let’s show the image:
fig.canvas.set_window_title('Pareto Plot Test Figure')
plt.show()
This should result in the following image (click here if the image doesn’t show up):
Installation
Since this is really a single python file, you can simply go to the GitHub page, simply download paretochart.py and put it in a directory that python can find it.
Alternatively, the file can be installed using:
$ pip install --upgrade paretochart
or:
$ easy_install --upgrade paretochart
If you are using Python3, download the compressed file from here, unzip and run:
$ 2to3 -w *.py
while in the unzipped directory, then run:
$ python3 setup.py install
NOTE: Administrative privileges may be required to perform any of the above install methods.
Contact
Please send feature requests, bug reports, or feedback to Abraham Lee.
1 maintainer

Metadata
1 maintainer
Release files for paretochart 1.0
For a detailed explanation of source distributions (sdists) and built distributions (wheels), please see the package formats documentation.
Source distribution (sdist)
| File | Size | Uploaded | |
|---|---|---|---|
| paretochart-1.0.tar.gz | 5.7 kB | Details |
Release files / paretochart-1.0.tar.gz
| Download URL | paretochart-1.0.tar.gz |
|---|---|
| Size | 5.7 kB |
| Tags | Source |
|
SHA-256 checksum How to use checksums |
124b6271282fd606f6ad85b129607ce6b4c7b5ac42211be34e773ddc71fab86f
|
|
BLAKE2b-256 checksum How to use checksums |
4ad50e2bd5c3b8c4870e1704886ee9d74479633eff548c959767248796658a17
|
| Upload date | |
|
Uploaded using Trusted Publishing? What is trusted publishing? |
No |














