scripts for running a GUI wrapper for PDFgetX3
Project description
pdfgetx3_gui
Update: Jan. 2026 - PDFgetX3 2.4.0 has been released, which is compatible with Python 3.11 - 3.13. The GUI works the same for the new version, but now you don't have to create a new environment for an older version of Python. The new version has some options which are not yet available in the GUI. Lorch function has been implemented, multiple backgrounds not yet.
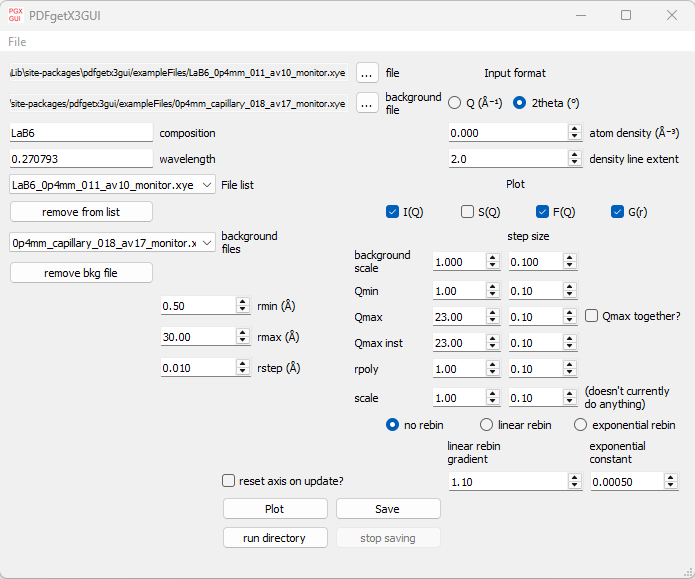
A gui for running PDFgetX3. I think it's a little easier to use than the interactive mode in PDFgetX3. Requires PDFgetX3 https://www.diffpy.org/products/pdfgetx.html, other dependencies (SciPy, numpy, matplotlib, PyQt5) will be installed through the installation (if not already installed). Recommended Python 3.10 (or later if you're using PDFgetX3 2.4+), and pip as your package manager, as this is the most recent version supported by PDFgetX3.
To install, either clone this repository and run pip install -e . (-e optional to make it editable), or from PyPi with pip install pdfgetx3gui. This creates a python package with an exe file called pdfgetx3gui in the python 'Scripts' folder, then it can be run with pdfgetx3gui in the terminal (if Scripts is in your PATH).
Plots update on changing parameter values. Log files are made to store the current configuration so the settings are the same on rerunning the script.
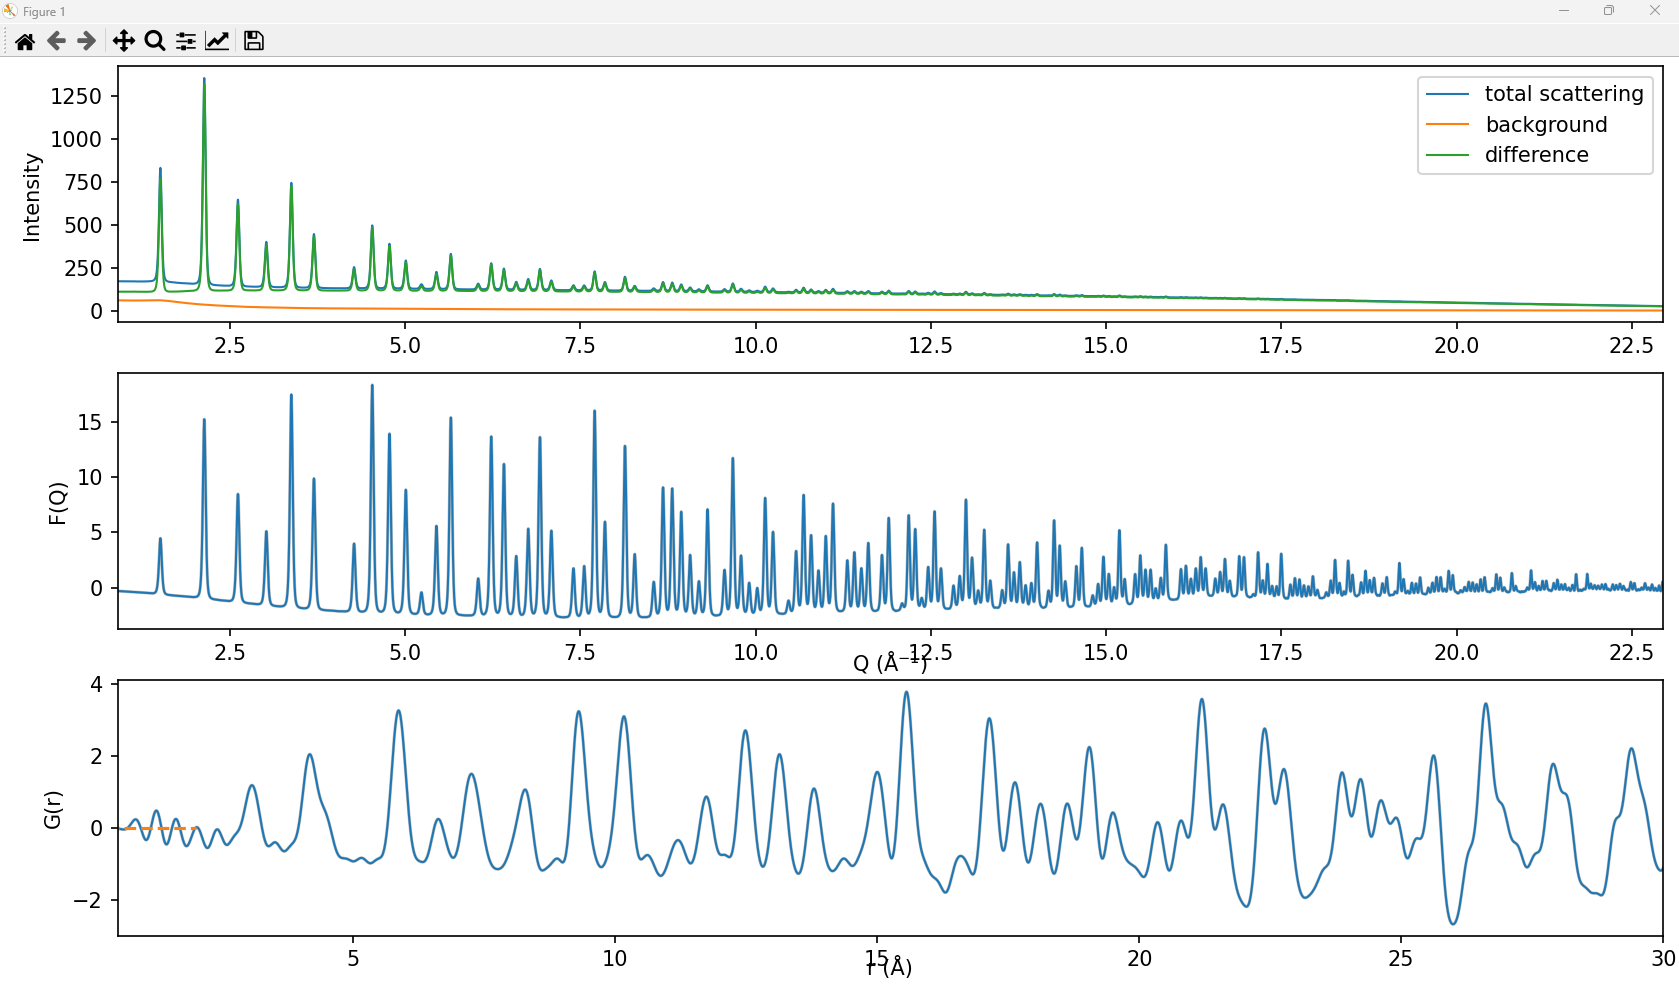
Selected measurement files and background files are put into lists so they can be easily accessed again later. Press 'Plot' to run the calculation and display the selected plots (can choose any from I(Q), S(Q), F(Q), and G(r)). Pressing 'Save' will save text files containing the data of the selected plots. If the input format is '2theta', 'Save' will also return the background subtracted data as a function of 2theta with the name of <base file name>_bkgsub.xy.
There's a rebinning option to reduce high Q noise. It's not so efficient, so could probably be faster.

Troubleshooting:
If there's issues with package conflicts, or Qt bugs, probably easiest to try a new Python 3.10 environment (or 3.13 if using the new PDFgetX3). Recommend using pip as your package manager (not conda's built in one). In conda e.g.
conda create -n pgx python==3.10
Install pdfgetx3 - if you don't have: get license, download from Columbia Technology Ventures https://inventions.techventures.columbia.edu/licenses/pdfgetx3-n3-s3-free-academic--113
pip install <diffpy pdfgetx3 filename>.whl
clone this repository, navigate to it and install
cd <path>/pdfgetx3_gui/
pip install -e .
Or from PyPi
pip install pdfgetx3gui
This will install other dependencies as well.
Project details
Release history Release notifications | RSS feed
Download files
Download the file for your platform. If you're not sure which to choose, learn more about installing packages.
Source Distribution
Built Distribution
Filter files by name, interpreter, ABI, and platform.
If you're not sure about the file name format, learn more about wheel file names.
Copy a direct link to the current filters
File details
Details for the file pdfgetx3gui-1.4.0.tar.gz.
File metadata
- Download URL: pdfgetx3gui-1.4.0.tar.gz
- Upload date:
- Size: 350.9 kB
- Tags: Source
- Uploaded using Trusted Publishing? No
- Uploaded via: twine/6.1.0 CPython/3.13.2
File hashes
| Algorithm | Hash digest | |
|---|---|---|
| SHA256 |
a7ac8cf1f525cf61dd63c4a2dea08f36f7e82e008aa7393cea08e4e23dda1089
|
|
| MD5 |
2bc9b2fc4a688544fa951a23acfeba1c
|
|
| BLAKE2b-256 |
97b1efb40dabf1dd332e4811eb5269951fff2b79cbde2e449a5559e921f73497
|
File details
Details for the file pdfgetx3gui-1.4.0-py3-none-any.whl.
File metadata
- Download URL: pdfgetx3gui-1.4.0-py3-none-any.whl
- Upload date:
- Size: 347.8 kB
- Tags: Python 3
- Uploaded using Trusted Publishing? No
- Uploaded via: twine/6.1.0 CPython/3.13.2
File hashes
| Algorithm | Hash digest | |
|---|---|---|
| SHA256 |
c22e1e198d9c99c64b13b3ecfa743d371b2ee4d8b3b1c2556fe06bbbe6dc8882
|
|
| MD5 |
53f3ec02d9f6ecdba7626184b91024b3
|
|
| BLAKE2b-256 |
68bfdd6898ca2a04fb3d4bcc766758e791ad9e69f130472171c8a35d3b17de9d
|


