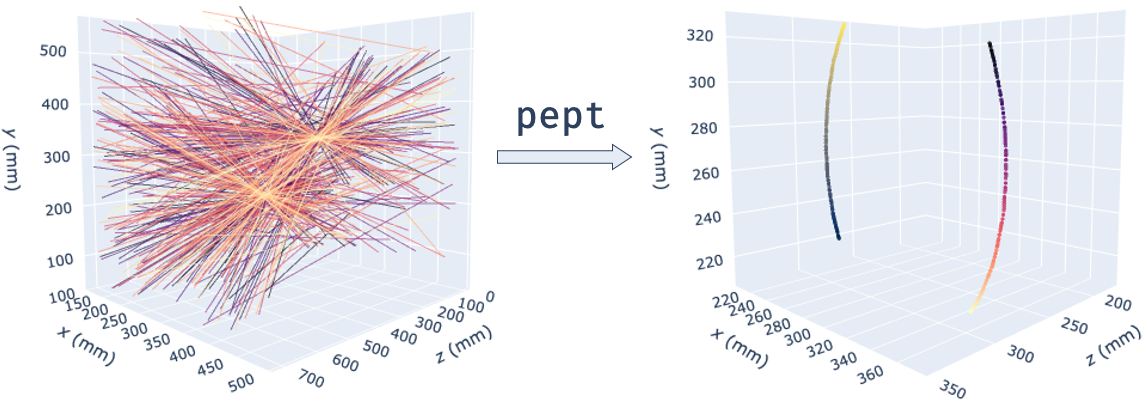
A Python library that unifies Positron Emission Particle Tracking (PEPT) research, including tracking, simulation, data analysis and visualisation tools.
Project description
The pept Library
A Python library that integrates all the tools necessary to perform research using Positron Emission Particle Tracking (PEPT). It includes algorithms for the location, identification and tracking of particles, in addition to tools for visualisation and analysis, and utilities allowing the realistic simulation of PEPT data.
Positron Emission Particle Tracking
PEPT is a technique developed at the University of Birmingham which allows the non-invasive, three-dimensional tracking of one or more 'tracer' particles through particulate, fluid or multiphase systems. The technique allows particle or fluid motion to be tracked with sub-millimetre accuracy and sub-millisecond temporal resolution and, due to its use of highly-penetrating 511keV gamma rays, can be used to probe the internal dynamics of even large, dense, optically opaque systems - making it ideal for industrial as well as scientific applications.
PEPT is performed by radioactively labelling a particle with a positron-emitting radioisotope such as fluorine-18 (18F) or gallium-66 (66Ga), and using the back-to-back gamma rays produced by electron-positron annihilation events in and around the tracer to triangulate its spatial position. Each detected gamma ray represents a line of response (LoR).
Getting Started
These instructions will help you get started with PEPT data analysis.
Prerequisites
This package supports Python 3.6 and above - it is built and tested for Python 3.6, 3.7 and 3.8 on Windows, Linux and macOS (thanks to conda-forge, which is awesome!).
You can install it using the batteries-included Anaconda distribution or the bare-bones Python interpreter. You can also check out our Python and pept tutorials here.
Installation
The easiest and quickest installation, if you are using Anaconda:
conda install -c conda-forge pept
You can also install the latest release version of pept from PyPI:
pip install --upgrade pept
Or you can install the development version from the GitHub repository:
pip install --upgrade git+https://github.com/uob-positron-imaging-centre/pept
Example usage
A minimal analysis script using the PEPT-ML algorithm from the pept.tracking.peptml package:
import pept
from pept.tracking import peptml

# Read in LoRs from a web-hosted CSV file.
lors_raw = pept.utilities.read_csv(
    ("https://raw.githubusercontent.com/uob-positron-imaging-centre/"
     "example_data/master/sample_2p_42rpm.csv"),    # Concatenate long string
    skiprows = 16                                   # Skip file header
)

# Encapsulate LoRs in a `LineData` subclass and compute cutpoints.
lors = pept.scanners.ParallelScreens(lors_raw, screen_separation = 712,
                                     sample_size = 200)
cutpoints = peptml.Cutpoints(lors, max_distance = 0.15)

# Cluster cutpoints using HDBSCAN and extract tracer locations.
clusterer = peptml.HDBSCANClusterer()
centres = clusterer.fit(cutpoints)

# Plot tracer locations using Plotly.
grapher = pept.visualisation.PlotlyGrapher()
grapher.add_points(centres)
grapher.show()
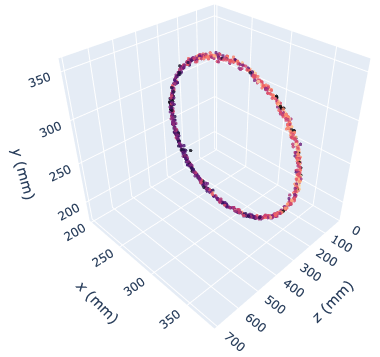
Running the above code initialises 80,000 lines of PEPT data from an online location (containing the same experiment as before - two tracers rotating at 42 RPM), transforms lines of response into accurate tracer locations and plots them in a browser-based interactive 3D graph (live version available here):
You can download some PEPT data samples from the UoB Positron Imaging Centre's Repository:
$> git clone https://github.com/uob-positron-imaging-centre/example_data
Tutorials and Documentation
A very fast-paced introduction to Python is available here; it is aimed at engineers whose background might be a few lines written MATLAB, as well as moderate C/C++ programmers.
A beginner-friendly tutorial for using the pept package is available here.
The links above point to Google Colaboratory, a Jupyter notebook-hosting website that lets you combine text with Python code, executing it on Google servers. Pretty neat, isn't it?
Full documentation for the pept package is available here.
Performance
Significant effort has been put into making the algorithms in this package as fast as possible. The most computionally-intensive parts have been implemented in C / Cython and parallelised using joblib and concurrent.futures.ThreadPoolExecutor. For example, using the peptml subpackage, analysing 1,000,000 LoRs on the author's machine (mid 2012 MacBook Pro) takes ~26 s.
The tracking algorithms in pept.tracking successfully scaled up to hundreds of processors on BlueBEAR, the University of Birmingham's awesome supercomputer.
Help and Support
We recommend you check out our tutorials. If your issue is not suitably resolved there, please check the issues page on our GitHub. Finally, if no solution is available there, feel free to open an issue; the authors will attempt to respond as soon as possible.
Contributing
At the moment, the subpackages in pept.tracking are biased towards PEPT-ML,
as there aren't many algorithms integrated into package yet. New algorithms
and/or recommendations for the package are more than welcome! pept aims to be
a community effort, be it academic, industrial, medical, or just from PEPT
enthusiasts - so it is open for help with documentation, algorithms, utilities
or analysis scripts, tutorials, and pull requests in general! To contribute please fork the project, make your changes and submit a pull request. We will do our best to work through any issues with you and get your code merged into the main branch.
Citing
If you used this codebase or any software making use of it in a scientific publication, we ask you to cite the following paper:
Nicuşan AL, Windows-Yule CR. Positron emission particle tracking using machine learning. Review of Scientific Instruments. 2020 Jan 1;91(1):013329.
Licensing
The pept package is GNU v3.0 licensed.
Copyright (C) 2020 Andrei Leonard Nicusan.
Project details
Release history Release notifications | RSS feed
Download files
Download the file for your platform. If you're not sure which to choose, learn more about installing packages.


