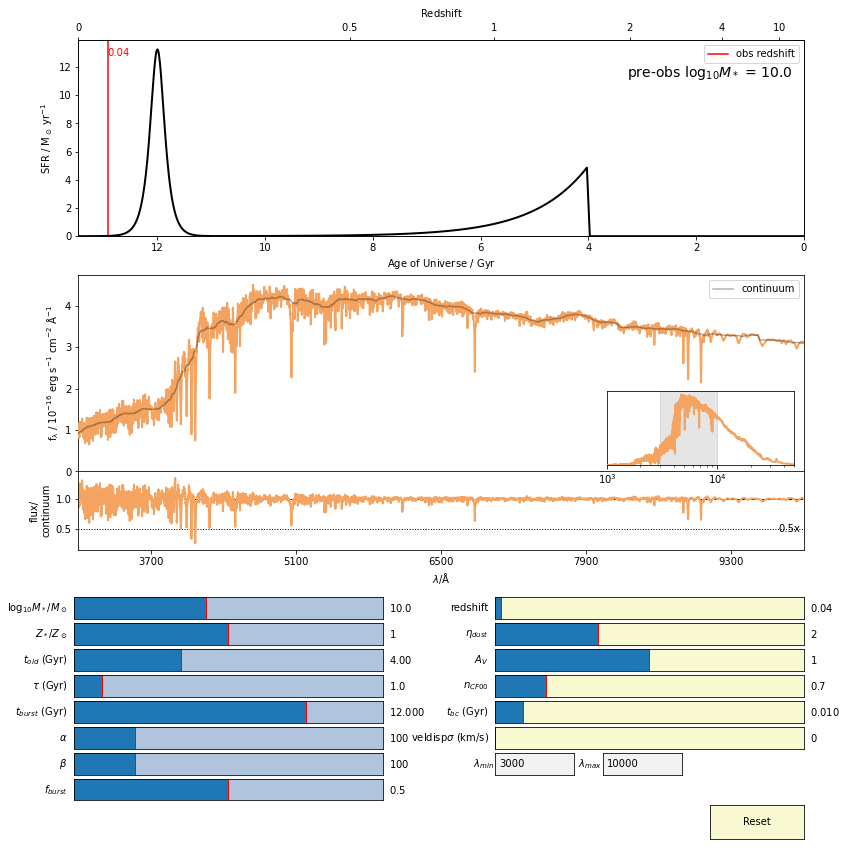
Small interactive GUI/visualizer tool for SPS spectra
Project description
pipes_vis
A small, interactive GUI/visualizer tool for SPS spectra, powered by Adam Carnall's Bayesian Analysis of Galaxies for Physical Inference and Parameter EStimation (BAGPIPES)
To install, type pip install pipes_vis.
Dependencies: bagpipes, numpy, matplotlib, astropy (visualizer still works even if you do not install multinest and pymultinest as instructed by bagpipes' installation)
For requests regarding making the visualizer avaliable as a web interactive tool much like sengi https://www.christopherlovell.co.uk/sengi/, I will have to see how to do it. To be decided in the future.
Project details
Download files
Download the file for your platform. If you're not sure which to choose, learn more about installing packages.
Source Distribution
Built Distribution
Hashes for pipes_vis-0.4.0-py3-none-any.whl
| Algorithm | Hash digest | |
|---|---|---|
| SHA256 | 1ea3f4c3087d8af1c44edf3584a1cdc36e2823d6197f15f914ad3e96b98a4b3f |
|
| MD5 | c8981a7160b367cf47880b1694cd1464 |
|
| BLAKE2b-256 | eb4ebf140db158d554540641a8cc7199175444aa8613f258c8b8750392bb5976 |


