Pixel histograms.

Project description
PixHist

pip install pixhist
PixHist - pixel histogram.
Dependencies: Numba, NumPy, and Matplotlib to use pixhist.rendering.
import matplotlib.pyplot as plt
from numba import njit
import numpy as np
import pixhist
import pixhist.rendering
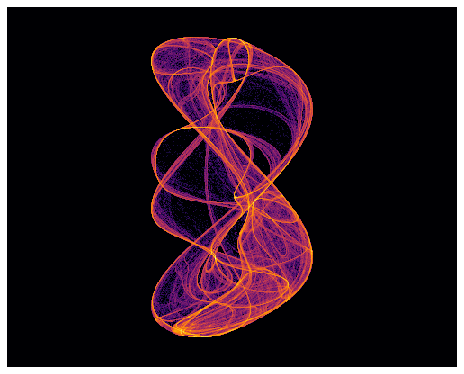
Example 1: create a pixhist from a generator
The generator should have no arguments, and return the values x, y:
generator() -> x, y
It should be compiled with Numba's njit / jit.
@njit
def gen():
    """A Clifford Attractor"""
    x, y = 0, 0
    while True:
        yield x, y
        x_ = np.sin(2.27 * y) + 0.66 * np.cos(2.27 * x)
        y_ = np.sin(1.13 * x) + 2.16 * np.cos(1.13 * y)
        x, y = x_, y_

r = pixhist.estimate_range(gen, n_iter=100_000)
r = pixhist.scale_range(r, 1.2)

N_ITER = 1000_000
W = 500
H = 400
hist = pixhist.from_gen(gen, N_ITER, W, H, range=r, make_xy_proportional=True, log=True)

pixhist.rendering.plot(hist)
plt.show()
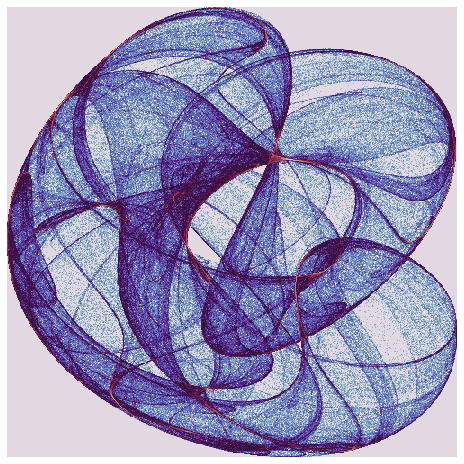
Example 2: using a generator factory
Create a 'generator factory' to get around the fact that the generator should have no arguments.
def get_clifford_generator(a, b, c, d, x_i=0, y_i=0):
    @njit
    def gen():
        x, y = x_i, y_i
        while True:
            yield x, y
            x_ = np.sin(a * y) + c * np.cos(a * x)
            y_ = np.sin(b * x) + d * np.cos(b * y)
            x, y = x_, y_
    return gen

params = [1.8, -1.4, -1.5, -0.71]
gen = get_clifford_generator(*params)
r = pixhist.estimate_range(gen, n_iter=100_000)

N_ITER = 1000_000
W, H = 500, 500
hist = pixhist.from_gen(gen, N_ITER, W, H, range=r, make_xy_proportional=False, log=True)

pixhist.rendering.plot(hist, cmap='twilight')
plt.show()
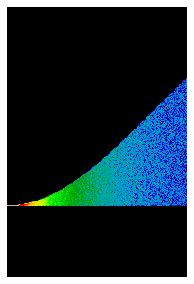
Example 3: pixhist from arrays
Create a pixel histogram from two arrays of the same length.
x_vals = np.random.random(100_000)
y_vals = np.sin(x_vals)**2 * np.random.random(100_000)

W, H = 200, 300
hist = pixhist.from_arrays(x_vals, y_vals, W, H, make_xy_proportional=True, log=True)

pixhist.rendering.plot(hist, cmap='nipy_spectral')
plt.show()
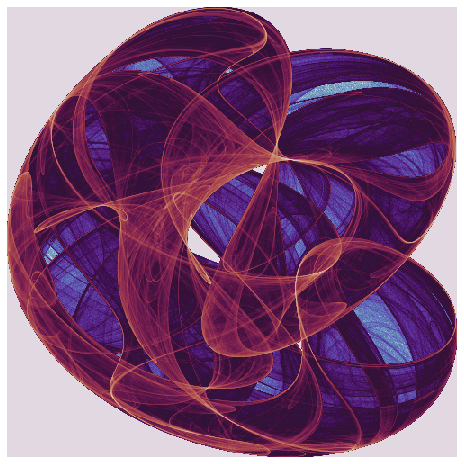
Example 4: the advantage of using generators
You can have a large number of iterations, since you don't need to store the arrays x_vals, y_vals in memory. (Time becomes the limiting factor).
from magic_timer import MagicTimer

params = [1.8, -1.4, -1.5, -0.71]
gen = get_clifford_generator(*params)

r = pixhist.estimate_range(gen, n_iter=100_000)

N_ITER = 100_000_000
W, H = 500, 500

t = MagicTimer()
hist = pixhist.from_gen(gen, N_ITER, W, H, range=r, make_xy_proportional=False, log=True)
print('Time elapsed:', t)

pixhist.rendering.plot(hist, cmap='twilight')
plt.show()
Time elapsed: 8.4 seconds
Release history Release notifications | RSS feed

Download files
Download the file for your platform. If you're not sure which to choose, learn more about installing packages.
Source Distribution
Built Distribution
Filter files by name, interpreter, ABI, and platform.
If you're not sure about the file name format, learn more about wheel file names.
Copy a direct link to the current filters
File details
Details for the file pixhist-0.0.2.tar.gz.
File metadata
- Download URL: pixhist-0.0.2.tar.gz
- Upload date:
- Size: 6.9 kB
- Tags: Source
- Uploaded using Trusted Publishing? No
- Uploaded via: twine/3.1.1 pkginfo/1.5.0.1 requests/2.21.0 setuptools/42.0.2 requests-toolbelt/0.9.1 tqdm/4.31.1 CPython/3.7.3
File hashes
| Algorithm | Hash digest | |
|---|---|---|
| SHA256 |
6229d8ae9e226ef2fbf7482e0b2367f51c3d92e981ffb0215af5078765df96a8
|
|
| MD5 |
adb4cb763747c641c9060bd4c71276b7
|
|
| BLAKE2b-256 |
582b6a6b01fb51c3b3017f3a20467a150c9bfaecd34322ace3c2f9ab7e107247
|
File details
Details for the file pixhist-0.0.2-py3-none-any.whl.
File metadata
- Download URL: pixhist-0.0.2-py3-none-any.whl
- Upload date:
- Size: 8.8 kB
- Tags: Python 3
- Uploaded using Trusted Publishing? No
- Uploaded via: twine/3.1.1 pkginfo/1.5.0.1 requests/2.21.0 setuptools/42.0.2 requests-toolbelt/0.9.1 tqdm/4.31.1 CPython/3.7.3
File hashes
| Algorithm | Hash digest | |
|---|---|---|
| SHA256 |
7a6e3d09d31225bd77ae1efa5acaefb01fac50a97b94c546b0dfca5c119e914f
|
|
| MD5 |
5551b9b4a641e8104bd7f0e9b0390224
|
|
| BLAKE2b-256 |
bd56e64666af0caa75e44723dc7b66b84784af065f588bf9f180033fc16d0de3
|


