Plot an Artificial Neural Network (ANN) model

Project description
Requirements
- Python >= 3.6 (There are f strings)
- matpltolib
- numpy
Motivation
There are other libs that can plot ANNs, why writing your own?
This implementation is completely based on matplotlib, and doesn't require any additional library like Viz or PyGraph.
This also means that is natively compatible with jupyter noteboks
Furthermore you can also create animations that work natively in HTML pages (can't be demonstrated here since github doesn't allow script tags execution)
%%capture
from matplotlib import animation, rc
from IPython.display import HTML
from itertools import chain

fig, ax = plt.subplots()
ax, nodes, edges = ann([3, 5, 2], ax=ax)
ax.set_aspect('equal')
lines = list(chain.from_iterable(chain.from_iterable(edges)))
def animate(i, lw):
    lw = np.roll(lw, i)
    for w, line in zip(lw, lines):
        line.set_linewidth(w)
    return lines

lw = np.random.rand(len(lines))
anim = animation.FuncAnimation(fig, animate, fargs=(lw,),
                               frames=100, interval=60, repeat=True,
                               blit=True)
# HTML(anim.to_jshtml())
Usage
The only import you need is the ann() function from the plot_ann module (which is the only module)
from plot_ann import ann
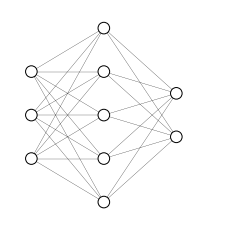
To draw a network with default settings just pass the dimensionality of layers as a List[int]
ax, *_ = ann([3, 5, 2])
ax.set_aspect('equal')
The ann() function returns ax, nodes, edges. Where ax is an instance of matplotlib.axes; nodes is a structured List of matplotlib.patches.Circle and edges is a structured list of matplotlib.lines.Line2D.
ann([1, 1])
(<AxesSubplot:>,
 [[<matplotlib.patches.Circle at 0x7f1f261929a0>],
  [<matplotlib.patches.Circle at 0x7f1f261929d0>]],
 [[[<matplotlib.lines.Line2D at 0x7f1f26147130>]]])
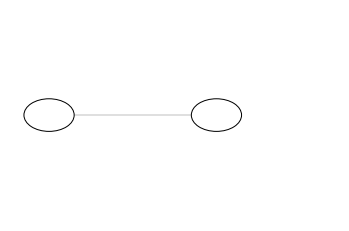
Figure customization
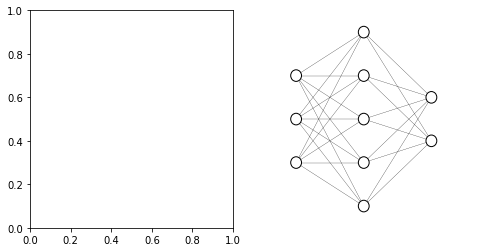
Subplotting
If no ax instance is passed, a new figure and axis will be instantiatied (fig, ax = plt.subplots()) and the ax is returned.
Alternatively, one can pass an ax:
import matplotlib.pyplot as plt
fig, [_, ax] = plt.subplots(1, 2, figsize=(8, 4))
ann([3, 5, 2], ax=ax);
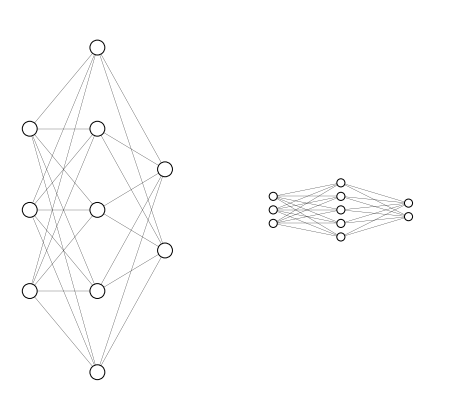
Plot size
The plot proportions can be changed using the width and height paramters
fig, axes = plt.subplots(1, 2, figsize=(8, 8))
ax1, ax2 = axes
ann([3, 5, 2], ax=ax1, height=2)
ann([3, 5, 2], ax=ax2, width=3)
for ax in axes:
    ax.set_aspect('equal')
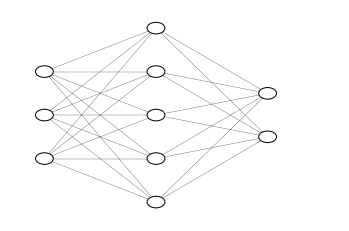
If you want to preserve the aspect of the axis, remember to either set ax.set_aspect('equal') or manually set the right figsize. For example, default plt paramters will produce a non-square plot and affect the aspect of the network.
ann([3, 5, 2]);
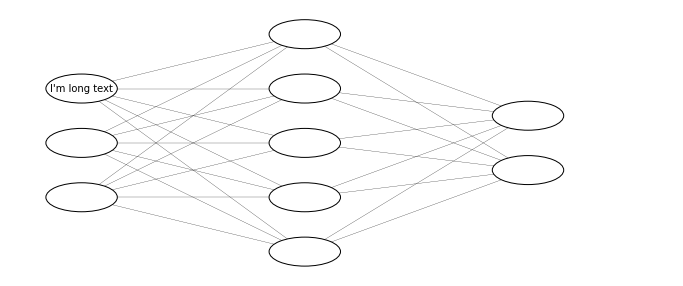
Since in plt text is not affected by this distorsion, you can play with this to produce elliptical nodes with enough space to write long text inside of them
fig, ax = plt.subplots(figsize=(12,5))
ax, nodes, _ = ann([3, 5, 2], ax=ax, radius=2)
ax.text(*nodes[0][0].center, 'I\'m long text', zorder=10, va='center', ha='center');
Network Customization
The network is fairly customizable
Layers
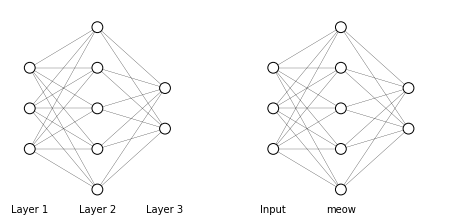
Set the layer_labels
layer_labels=Truewill set layer labels automaticallylayer_labels=Listwill set layer labels from the list from left to right
fig, axes = plt.subplots(1, 2, figsize=(8, 4))
ax1, ax2 = axes
ann([3, 5, 2], ax=ax1, layer_labels=True)
ann([3, 5, 2], ax=ax2, layer_labels=['Input', 'meow']);
for ax in axes:
    ax.set_aspect('equal')
Nodes
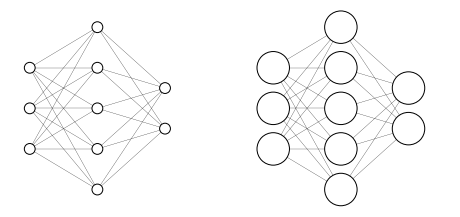
- Change the
radiusparameter to customize the radius of nodes:
fig, axes = plt.subplots(1, 2, figsize=(8, 4))
ax1, ax2 = axes
ann([3, 5, 2], ax=ax1)
ann([3, 5, 2], ax=ax2, radius=3);
for ax in axes:
    ax.set_aspect('equal')
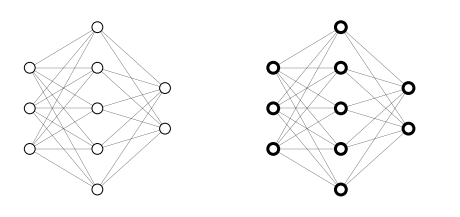
- Change the
node_lw(linewidth) of nodes:
fig, axes = plt.subplots(1, 2, figsize=(8, 4))
ax1, ax2 = axes
ann([3, 5, 2], ax=ax1)
ann([3, 5, 2], ax=ax2, node_lw=3);
for ax in axes:
    ax.set_aspect('equal')
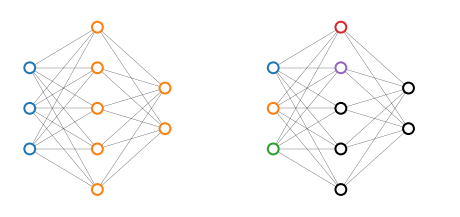
- Change the
node_color:node_colors=Truewill set colors automatically (C0 for input layer and C1 for everything else)node_colors=Listwill set colors specified in the list starting from top-most input the first layer and proceeding towards the bottom and then towards the right (if the list is shorter than the number of nodes default color is applied)
import matplotlib.pyplot as plt
fig, axes = plt.subplots(1, 2, figsize=(8, 4))
ax1, ax2 = axes
ann([3, 5, 2], ax=ax1, node_colors=True, node_lw=2)
ann([3, 5, 2], ax=ax2, node_colors=['C0', 'C1', 'C2', 'C3', 'C4'], node_lw=2);
for ax in axes:
    ax.set_aspect('equal')
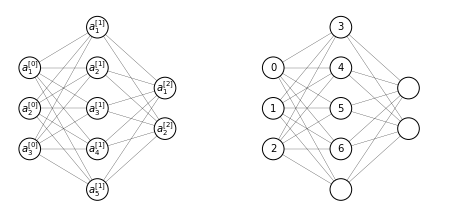
- Set
node_labels:node_labels=Truewill set labels automaticallynode_labels=Listwill set labels specified in the list starting from top-most input the first layer and prociding towards the bottom and then towards the right (if the list is shorter than the number of nodes no label is applied)
fig, axes = plt.subplots(1, 2, figsize=(8, 4))
ax1, ax2 = axes
architecture = [3, 5, 2]
ann(architecture, ax=ax1, radius=2, node_labels=True)
ann(architecture, ax=ax2, radius=2, node_labels=range(sum(architecture)-3));
for ax in axes:
    ax.set_aspect('equal')
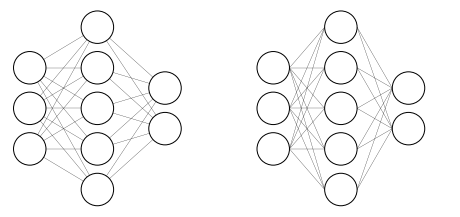
Edges
- Draw edges from the center of the node with
edge_from_center=Trueor from the edge of the node withedge_from_center=False
fig, axes = plt.subplots(1, 2, figsize=(8, 4))
ax1, ax2 = axes
ann([3, 5, 2], ax=ax1, radius=3)
ann([3, 5, 2], ax=ax2, edge_from_center=False, radius=3);
for ax in axes:
    ax.set_aspect('equal')
- Change the
edge_lw(linewidth)
fig, axes = plt.subplots(1, 2, figsize=(8, 4))
ax1, ax2 = axes
ann([3, 5, 2], ax=ax1)
ann([3, 5, 2], ax=ax2, edge_lw=2);
for ax in axes:
    ax.set_aspect('equal')
- Change the
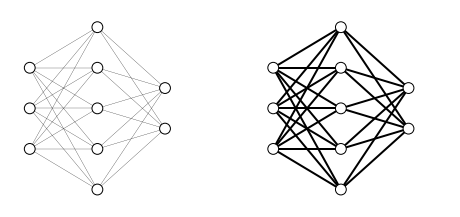
edge_colors:edge_colors=Truewill set colors automatically (C0 for input layer and C1 for everything else)edge_colors=Listwill set colors specified in the list starting from top-most input the first layer and proceeding towards the bottom and then towards the right (if the list is shorter than the number of edges default color is applied)
import matplotlib.pyplot as plt
fig, axes = plt.subplots(1, 2, figsize=(8, 4))
ax1, ax2 = axes
ann([3, 5, 2], ax=ax1, edge_colors=True, edge_lw=1)
ann([3, 5, 2], ax=ax2, edge_colors=['C0', 'C1', 'C2', 'C3', 'C4'], edge_lw=1);
for ax in axes:
    ax.set_aspect('equal')

- Set
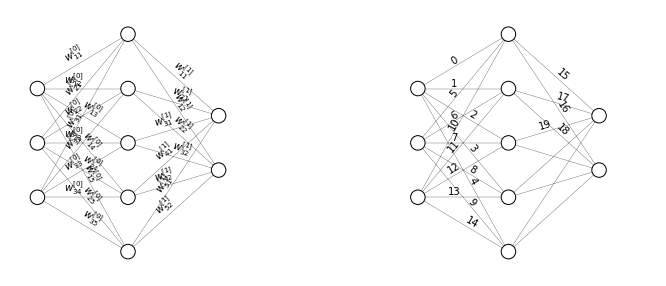
edge_labels:edge_labels=Truewill set labels automaticallyedge_labels=Listwill set labels specified in the list starting from top-most input the first layer and proceeding towards the bottom and then towards the right (if the list is shorter than the number of edges no label is applied)
import numpy as np
fig, axes = plt.subplots(1, 2, figsize=(12.5, 5))
ax1, ax2 = axes
architecture = [3, 5, 2]
ann(architecture, ax=ax1, edge_labels=True)
ann(architecture, ax=ax2, edge_labels=range(np.prod(architecture)-10));
for ax in axes:
    ax.set_aspect('equal')
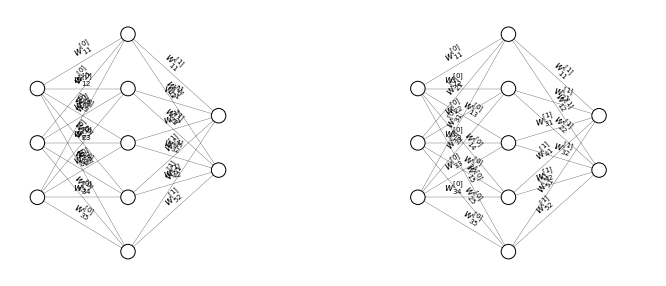
- Change
edge_label_spacing:edge_label_spacing=0will have all edge labels of a layer in the center of the edge (if all labels are drawn some of them will overlap)edge_label_spacing>0will displace a label left if its rotation angle is > 0 else right
import numpy as np
fig, axes = plt.subplots(1, 2, figsize=(12.5, 5))
ax1, ax2 = axes
architecture = [3, 5, 2]
ann(architecture, ax=ax1, edge_labels=True, edge_label_spacing=0)
ann(architecture, ax=ax2, edge_labels=True, edge_label_spacing=1);
for ax in axes:
    ax.set_aspect('equal')
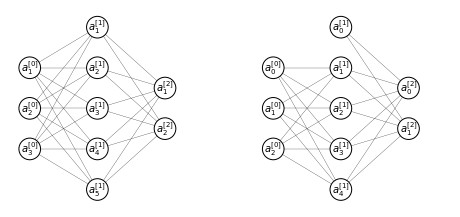
bias=Truewill assume that the topmost input inarchitectureis the bias for each layer (no edges reaching them from the previous layer) and will change the indexing fornode_labels=Trueandedge_labels=True
fig, axes = plt.subplots(1, 2, figsize=(8, 4))
ax1, ax2 = axes
ann([3, 5, 2], ax=ax1, radius=2, bias=False, node_labels=True)
ann([3, 5, 2], ax=ax2, radius=2, bias=True, node_labels=True)
for ax in axes:
    ax.set_aspect('equal')
Release history Release notifications | RSS feed


Download files
Download the file for your platform. If you're not sure which to choose, learn more about installing packages.
Source Distribution
Built Distribution
Filter files by name, interpreter, ABI, and platform.
If you're not sure about the file name format, learn more about wheel file names.
Copy a direct link to the current filters
File details
Details for the file plot_ann-1.1.3.tar.gz.
File metadata
- Download URL: plot_ann-1.1.3.tar.gz
- Upload date:
- Size: 5.5 kB
- Tags: Source
- Uploaded using Trusted Publishing? No
- Uploaded via: twine/3.3.0 pkginfo/1.7.0 requests/2.25.1 setuptools/53.0.0 requests-toolbelt/0.9.1 tqdm/4.56.2 CPython/3.6.9
File hashes
| Algorithm | Hash digest | |
|---|---|---|
| SHA256 |
3eeee432e9ba8fd43ba571bb5a0e423659afe8f56cb557e0e77bcbb55211a3f0
|
|
| MD5 |
bfa819678f8ba3b013c14f36d152ce6e
|
|
| BLAKE2b-256 |
7a3b5562924f1741aa29456d2aee9e71f2f2783105c64ab52dbf9b129505eacb
|
File details
Details for the file plot_ann-1.1.3-py3-none-any.whl.
File metadata
- Download URL: plot_ann-1.1.3-py3-none-any.whl
- Upload date:
- Size: 5.1 kB
- Tags: Python 3
- Uploaded using Trusted Publishing? No
- Uploaded via: twine/3.3.0 pkginfo/1.7.0 requests/2.25.1 setuptools/53.0.0 requests-toolbelt/0.9.1 tqdm/4.56.2 CPython/3.6.9
File hashes
| Algorithm | Hash digest | |
|---|---|---|
| SHA256 |
edb665e84a6fe93ba6ebbcccc9403a3b963519914d09e5bd2f41ccc8108ae799
|
|
| MD5 |
5d1a2d5aa78392c7f29ec4fe3203e35a
|
|
| BLAKE2b-256 |
28d832132b0f858fa45807e091d048d24f9812e9e0be2543ca06fd7a47096941
|


