Command Line Interface for Data Visualization

Project description
Plot CLI
Plot CLI is command line interface for data visualization.


It works on Python 3.6.1 and greater.
Installation
Install using pip:
pip install plot-cli
Getting Started
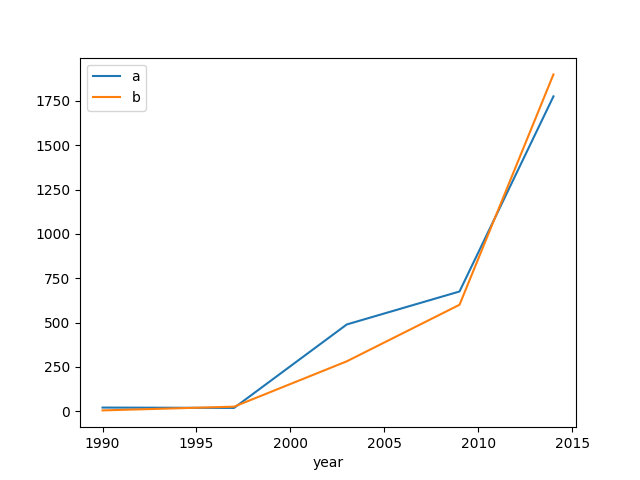
You can output a graph from stdin or a file.
cat data.csv | plot line --header --index-col year
See the documentation for detailed usage and examples.
Change Log
See Change Log.
Release history Release notifications | RSS feed


Download files
Download the file for your platform. If you're not sure which to choose, learn more about installing packages.
Source Distribution
plot-cli-0.2.0.tar.gz
(5.6 kB
view details)
Built Distribution
Filter files by name, interpreter, ABI, and platform.
If you're not sure about the file name format, learn more about wheel file names.
Copy a direct link to the current filters
File details
Details for the file plot-cli-0.2.0.tar.gz.
File metadata
- Download URL: plot-cli-0.2.0.tar.gz
- Upload date:
- Size: 5.6 kB
- Tags: Source
- Uploaded using Trusted Publishing? No
- Uploaded via: poetry/1.0.10 CPython/3.8.5 Linux/5.4.0-1025-azure
File hashes
| Algorithm | Hash digest | |
|---|---|---|
| SHA256 |
dc37e9487a49511e047d574b02b57467af3c04fcb95cbe090b5879436db4b85f
|
|
| MD5 |
6d2cb1f9c5aa0cef14092699ac9acdd7
|
|
| BLAKE2b-256 |
86e6f3ba7633985e1996bbe5e7b4f35631daf032abc9eb8447081594dc8609af
|
File details
Details for the file plot_cli-0.2.0-py3-none-any.whl.
File metadata
- Download URL: plot_cli-0.2.0-py3-none-any.whl
- Upload date:
- Size: 6.4 kB
- Tags: Python 3
- Uploaded using Trusted Publishing? No
- Uploaded via: poetry/1.0.10 CPython/3.8.5 Linux/5.4.0-1025-azure
File hashes
| Algorithm | Hash digest | |
|---|---|---|
| SHA256 |
12574d5505acad8984fb21e762cd5eed84eee5c187cdb225457cd251edad7515
|
|
| MD5 |
71f885b3e4e05241d7c5a9ed0214514b
|
|
| BLAKE2b-256 |
bcd20a46c29b7d023d594d25cd7f9ae9535fe69e6655d6c78778ddec823ce532
|


