plot gsheets by specifying columns

Project description
plot-gsheets
plot-gsheets is a small wrapper around the Google Sheets API (v4) to provide more convenient way to plot Google Sheets from Python scripts.
Links
Installation
This package runs under 3.5+, use pip to install:
pip install plot-gsheets
Usage
Importing plot_gsheets
>>> import plot_gsheets
Get all columns of google sheet
Syntax:
plot_gsheets.get_columns(SPREADSHEET_ID,sheet_name)
where SPREADSHEET_ID can be found like here in you google sheet URL:
https://docs.google.com/spreadsheets/d/SPREADSHEET_ID/edit#gid=0
and sheet_name can be found at the bottom left of window
example:
>>> plot_gsheets.get_columns('1SrZfvr2ee54r7HR1jGtAE9zHIj_Y-UzK9ok8bdwkpqc','Sheet1')
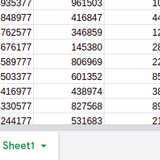
['timestamp', 'average_sales', 'offer_price']
Plot by specifying columns
Syntax:
plot_gsheets.plot_sheet_columns(SPREADSHEET_ID,sheet_name,x_column_name,y_column_name)
sheet columns can be found by using plot_gsheets.get_columns and thus x_column_name,y_column_name can be specified by seeing output
example :
>>> plot_gsheets.plot_sheet_columns('1SrZfvr2ee54r7HR1jGtAE9zHIj_Y-UzK9ok8bdwkpqc','Sheet1','timestamp','average_sales')
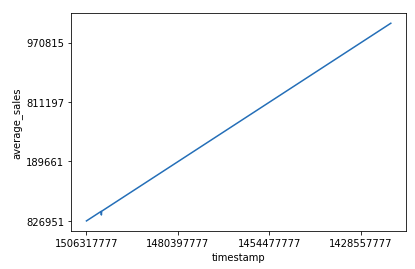
plot will be saved as plot.png
Google colab example :
https://colab.research.google.com/drive/1yIW8wunsHVJiwRKltNQ7fBi9ph37Xqu2?usp=sharing
Release history Release notifications | RSS feed


Download files
Download the file for your platform. If you're not sure which to choose, learn more about installing packages.
Source Distribution
Built Distribution
Filter files by name, interpreter, ABI, and platform.
If you're not sure about the file name format, learn more about wheel file names.
Copy a direct link to the current filters
File details
Details for the file plot_gsheets-0.4.tar.gz.
File metadata
- Download URL: plot_gsheets-0.4.tar.gz
- Upload date:
- Size: 3.8 kB
- Tags: Source
- Uploaded using Trusted Publishing? No
- Uploaded via: twine/3.1.1 pkginfo/1.4.2 requests/2.22.0 setuptools/45.2.0 requests-toolbelt/0.8.0 tqdm/4.30.0 CPython/3.8.5
File hashes
| Algorithm | Hash digest | |
|---|---|---|
| SHA256 |
5fafb94515a469f71776999de56db38933ebf7dfea402a9e227743904767c7f7
|
|
| MD5 |
d34b2c20cfb6eaa709748afeadc9aac1
|
|
| BLAKE2b-256 |
0fde5b6c5f8426699b69a674f762d8cc9bb46c319fec6cd7209522017acad7dc
|
File details
Details for the file plot_gsheets-0.4-py3-none-any.whl.
File metadata
- Download URL: plot_gsheets-0.4-py3-none-any.whl
- Upload date:
- Size: 4.2 kB
- Tags: Python 3
- Uploaded using Trusted Publishing? No
- Uploaded via: twine/3.1.1 pkginfo/1.4.2 requests/2.22.0 setuptools/45.2.0 requests-toolbelt/0.8.0 tqdm/4.30.0 CPython/3.8.5
File hashes
| Algorithm | Hash digest | |
|---|---|---|
| SHA256 |
ed6c9474e3996f5c3d30bce2df45bf6460298596eae34247bd1e5a433aba3ca7
|
|
| MD5 |
148b205910ea4c329d90240b6e95fc19
|
|
| BLAKE2b-256 |
055561188179a4e441711d68c0652562c1006a8fd798e96c0a27931e76051749
|


