A simple matplotlib based schedule plotter

Project description
A simple schedule plotter
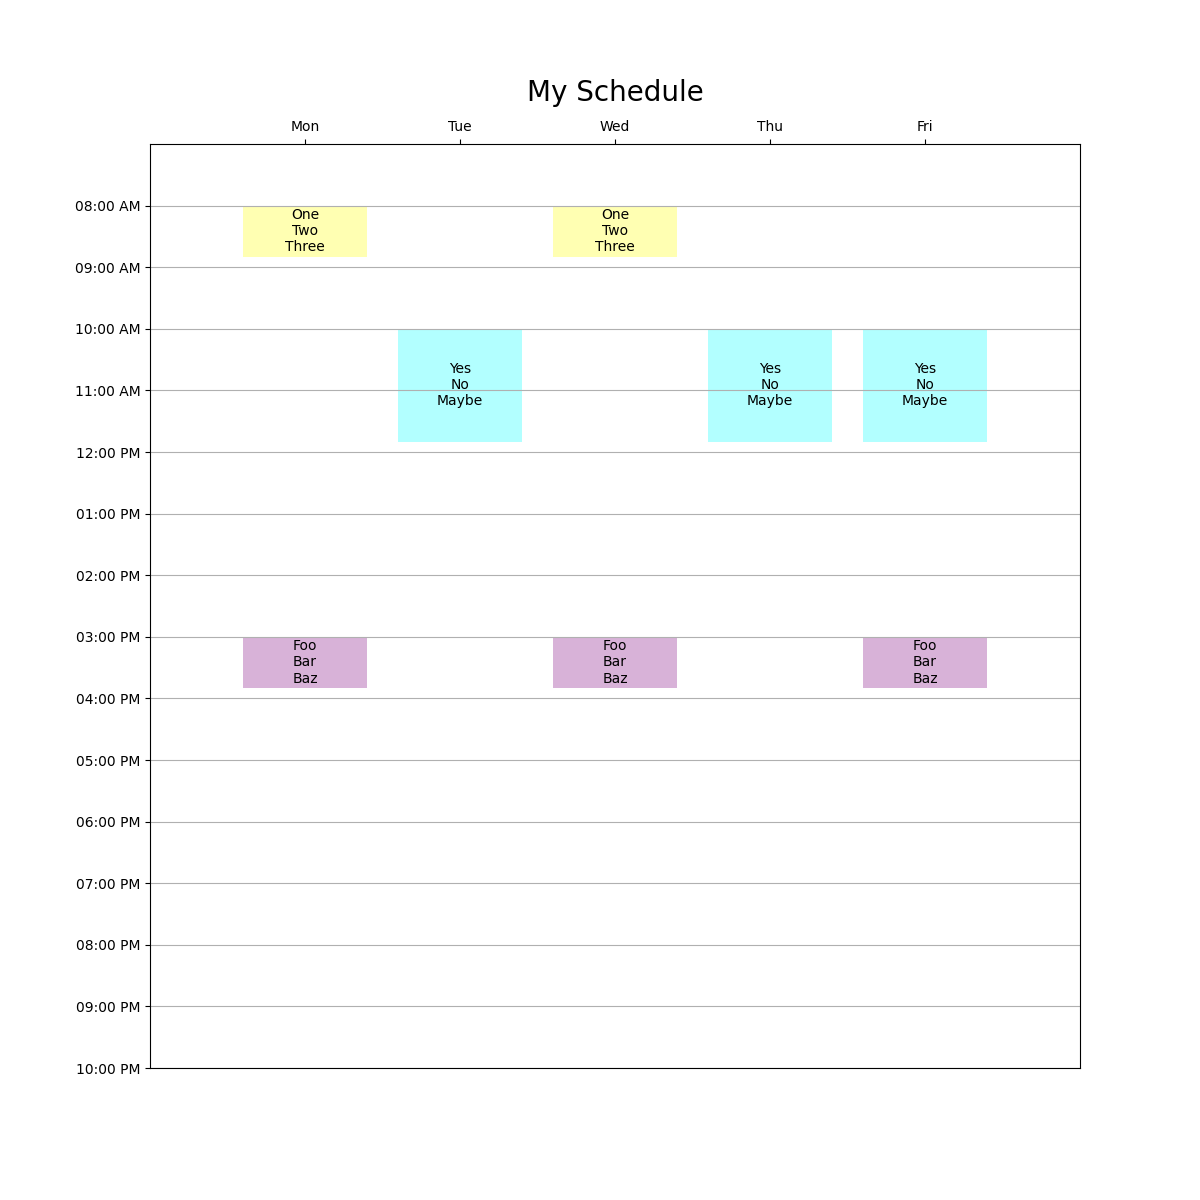
The csv/xlsx file needs to have columns "begin", "end", "days", and whatever text you want in the schedule boxes:
| begin | end | days | Label1 | Label2 | Label3 | |
|---|---|---|---|---|---|---|
| 0 | 08:00 AM | 08:50 AM | MW | One | Two | Three |
| 1 | 10:00 AM | 11:50 AM | TRF | Yes | No | Maybe |
| 2 | 03:00 PM | 03:50 PM | MWF | Foo | Bar | Baz |
For this CSV you could use this command line:
plotschedule --output bar.png --title "My Schedule" example/foo.csv --labels Label1 Label2 Label3
And you'd get this output:
You can also add a color column and use matplotlib colors.
Changes: 0.11 now works with excel too!
Changes: 0.12 allow for times that are already converted into 'float' hours (e.g. 8:30 AM -> 8.5, etc.)
Changes: 0.14 (yeah, skip 0.13!) reorganize init.py to put the function an module scope.
Changes: 0.15 Added --sheet argument to pull a particular sheet from an excel file.


Download files
Download the file for your platform. If you're not sure which to choose, learn more about installing packages.
Source Distribution
Built Distribution
Filter files by name, interpreter, ABI, and platform.
If you're not sure about the file name format, learn more about wheel file names.
Copy a direct link to the current filters
File details
Details for the file plotschedule-0.16.tar.gz.
File metadata
- Download URL: plotschedule-0.16.tar.gz
- Upload date:
- Size: 4.1 kB
- Tags: Source
- Uploaded using Trusted Publishing? No
- Uploaded via: twine/6.2.0 CPython/3.12.7
File hashes
| Algorithm | Hash digest | |
|---|---|---|
| SHA256 |
ec2648ba25ab61cdfc348337b88f795800d2f94c9739a098e02aaaea527452a4
|
|
| MD5 |
b78d900dd30f5b1cf5eeb47b2560e2c7
|
|
| BLAKE2b-256 |
68c3c9d062c7d20e084dcc56c758a07be8de46811146b93d90f66c4e964abfe0
|
File details
Details for the file plotschedule-0.16-py3-none-any.whl.
File metadata
- Download URL: plotschedule-0.16-py3-none-any.whl
- Upload date:
- Size: 4.7 kB
- Tags: Python 3
- Uploaded using Trusted Publishing? No
- Uploaded via: twine/6.2.0 CPython/3.12.7
File hashes
| Algorithm | Hash digest | |
|---|---|---|
| SHA256 |
945d3610febf45e90e88bdfa535047ca15293db82b3e2204a5d2caaaa4079a54
|
|
| MD5 |
f82ecb93787b297ed3d093793157cd99
|
|
| BLAKE2b-256 |
97643f67f5109a605c22f2d8208cd8562c051f44759a559337297cc351019415
|


