A package for plotting the tag history of repositories

Project description


A command line utility for viewing the trend of commit tagging within a repository over time.
Currently supports GIT and Mercurial repositories.
Fun fact, plottags was the 60115th package registered with PyPI.
Installation
pip install plottags
Usage
From within a repo…
$ plottags
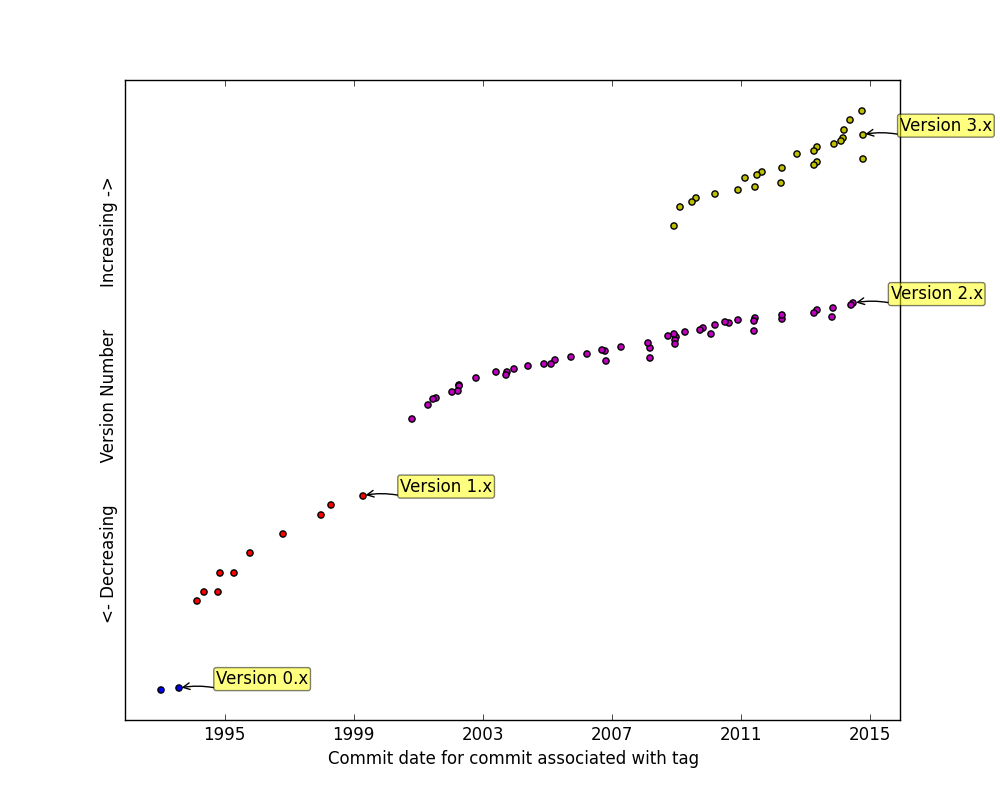
Example Results:
This plot is from the CPython project.


Download files
Download the file for your platform. If you're not sure which to choose, learn more about installing packages.
Source Distribution
plottags-0.1.2.tar.gz
(5.7 kB
view details)


