Compute and visualize observations phase coverage
Project description
portrait

Observation metrics for periodic events
A Python package to compute and visualize observation metrics for periodic events.
In Astronomy, portrait is useful to answer the following questions:
- How much of an orbit with period $P$ has been observed given certain observation times? (tutorial)
- What period $P$ matches with this list of events? (tutorial)
- How a certain target must be observed to cover all orbits with periods lower than $P$ days?
Documentation at portrait.readthedocs.io
Example
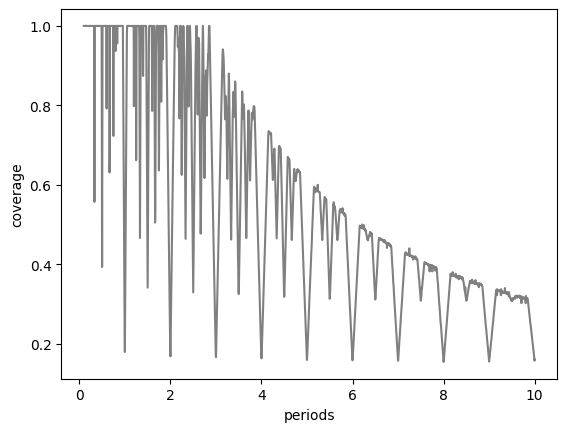
Given the range of periods you want to cover, here is how to compute the amout of phase covered by your observation times
from portrait import coverage

time = ... # your observation times
periods = np.linspace(0.1, 10, 2000)

covered = coverage(times)(periods)
And plotting it with matplotlib
import matplotlib.pyplot as plt

plt.subplot(111, xlabel="periods", ylabel="coverage")
plt.plot(periods, covered, c="0.5")
Installation
pip install portrait
Project details
Release history Release notifications | RSS feed
Download files
Download the file for your platform. If you're not sure which to choose, learn more about installing packages.
Source Distribution
portrait-0.0.5b0.tar.gz
(168.8 kB
view hashes)
Built Distribution
Close
Hashes for portrait-0.0.5b0-py3-none-any.whl
| Algorithm | Hash digest | |
|---|---|---|
| SHA256 | 7c75d15fe46efcdbf393baea01c0973be5d84423df73a74e6386c913d47c904d |
|
| MD5 | c7bcf435fb71f9b05c0377daf7a8e522 |
|
| BLAKE2b-256 | a24225f7acb391cb1d81bd938bb5942d2940eb33d8b53e9505a09246b71adddb |


