
RunSnakeRun
profile-viewer (RunSnakeRun) is a small GUI utility that allows you to view (Python) cProfile or Profile profiler dumps in a sortable GUI view. It allows you to explore the profiler information using a “square map” visualization or sortable tables of data. It also (experimentally) allows you to view the output of the Meliae “memory analysis” tool using the same basic visualisations.
Features
RunSnakeRun is a simple program, it doesn’t provide all the bells-and-whistles of a program like KCacheGrind, it’s intended to allow for profiling your Python programs, and just your Python programs. What it does provide, for profile viewing:
sortable data-grid views for raw profile information
identity: function name, file-name, directory name
time-spent: cumulative, cumulative-per, local and local-per time
overall data-grid view
(all) callers-of-this-function, (all) callees-of-this-function views
squaremap view of call tree
size proportional to amount of time spent by the given parent in the given function
squaremap view of packages/modules/functions
size proportional to time spent in each package/module/function
basic navigation (home, back, up)
For Meliae memory-dump viewing, it provides:
sortable data-grid views
squaremap of memory-usage
basic navigation
Installation
You will need to have all of wxPython, SquareMap and RunSnakeRun installed to use RunSnakeRun. You may also need the “python-profiler” package for your platform, which provides the pstats view. You will likely want to use your platform wxPython package (i.e. a pre-built binary). For Debian/Ubuntu distributions the prerequisite setup looks like this: RunSnakeRun and SquareMap will install well in a VirtualEnv if you would like to keep them isolated (normally you do not want to use the --no-site-packages flag if you are doing this). I recommend this approach rather than using easy_install directly on your Linux/OS-X host.
virtualenv runsnake
source runsnake/bin/activate
If you already have Python pip installed (a.k.a. pip), you should be able to install the Python packages with:
pip install profile-viewer
You will require a modern wxPython (e.g. 4.0) and Python 3.x (e.g. 3.3 through 3.6 installation. The setup will create a script named “runsnake” on Linux machines which launches the profile viewer. On OS-X machines a wrapper script runsnake is created that runs the runsnake32 executable with a flag to tell Python to use the 32-bit implementation (for wxPython compatibility). On Win32 machines, a Scripts:raw-latex:runsnake.exe executable is created. If you have added your scripts directory to the PATH then this will be available from the command-line.
Usage
If you are new to profiling you may wish to check out:
my (Mike Fletcher’s) presentation at PyCon 2009 which tries to explain the use of profiling as a tool for optimization in Python
W. Matthew Wilson’s presentation at PyOhio on optimizing Python code
cProfile Viewing
To use cProfile to capture your application’s profile data, either using the command-line, like so:
$ python -m cProfile -o <outputfilename> <script-name> <options>
Or in code, like so:
import cProfile
command = """reactor.run()"""
cProfile.runctx( command, globals(), locals(), filename="OpenGLContext.profile" )</pre>
To view the results of your run:
python runsnake.py OpenGLContext.profile
There will be a brief delay as the application is created and begins the loading process, then you should see something like this:
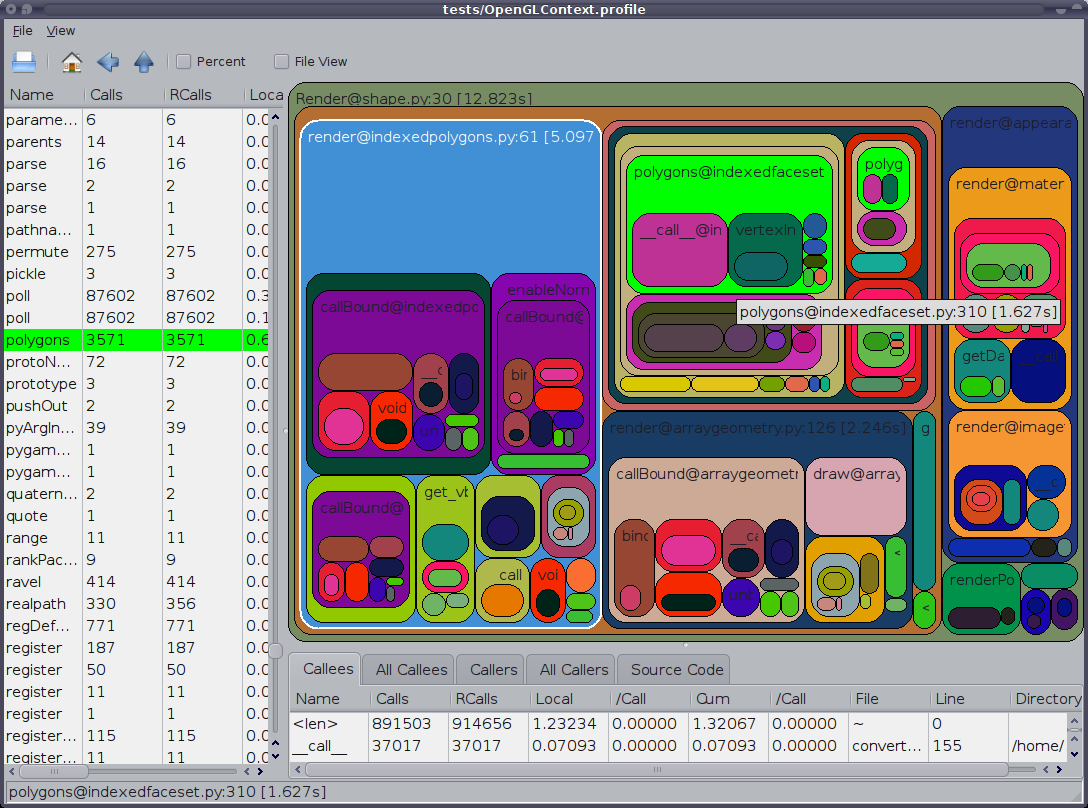
Screenshot of the application viewing a HotShot profile
Click on any column title to sort by that property within that list. Select a record in the left-most list view to see a breakdown of that record in the right-side list views. Choose the appropriate view on the right via the tabs. You can resize the borders between the lists and square-map views. You can select a package/module/function hierarchic view via the menus. You can also toggle use of percentage displays there.
Meliae Memory Analysis
Note: this feature is considered experimental, the memory consumed loading even a tiny meliae dump is enormous, so real-world programs will make RunSnakeRun quite slow and require a very large amount of RAM (far more than the process being viewed).
To install Meliae, you will need a working C extension compilation environment (Meliae uses a Cython extension):
easy_install meliae
Now instrument your application to be able to trigger a memory dump at the moment you would like to capture, like so:
from meliae import scanner
scanner.dump_all_objects( filename ) # you can pass a file-handle if you prefer
The memory dump will generally be quite large (e.g. 2MB to describe an application with 200KB of user-controllable memory usage (i.e. not the interpreter itself)) and for any real application will take an extremely long time to load (multiple minutes for 16MB dumps).
$ runsnakemem <filename>
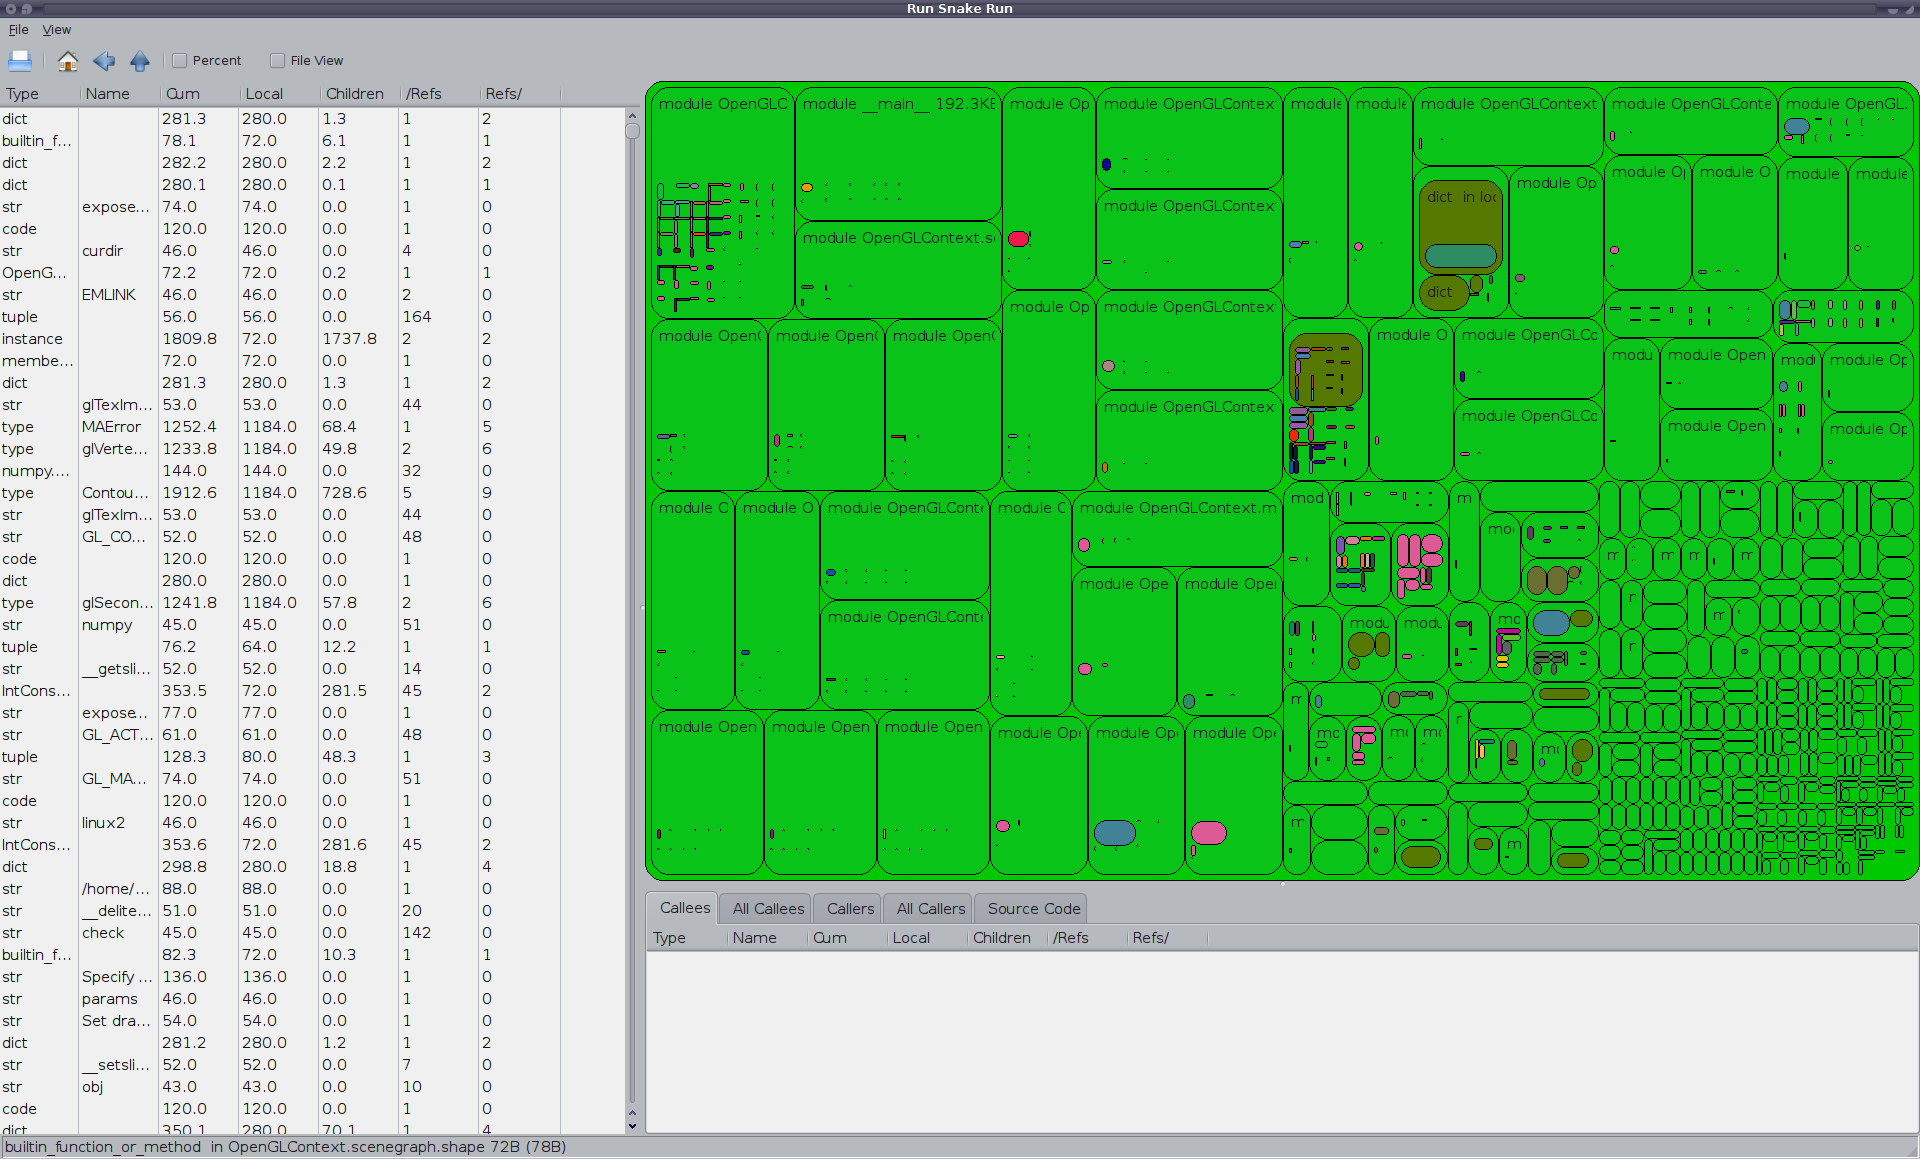
Screenshot of a meliae memory view
The Meliae loader in RunSnakeRun performs the following simplifications:
only displays memory which is reachable from a module (there is normally > 1MB of unreachable objects included in a meliae dump)
treats modules as memory-cost barriers, so referencing a module does not cost the referrer anything
treats all (reachable) references to an instance as sharing the cost of the instance equally
treats loops as being a separate object which holds all objects in the loop, breaking inter-loop references but retaining child references, all references to the loop members become references to the loop
eliminates dictionary objects from modules (always) and from types and classes when the dictionary is only referenced by the class/type, the cost of the dictionary is folded into the cost of the parent object (note: this means that function globals references are “0-cost” and do not create loops)
compresses large numbers (>=10 currently) of “simple” objects of the same type held by a single parent into a “” object with the type as the name
Even with those simplifications, however, the program is tracking most ints, strings, tuples, lists, etc. separately, which uses a large amount of RAM and slows down the GUI substantially.
Code Access and Contributions
RunSnakeRun is reasonably stable. I don’t tend to do much work on it, as it tends to just work. My (personal) current wish list for the project follows:
Speed up and reduce memory requirements for meliae loading
Clean up the meliae loader (was grown organically from a quick hack and doesn’t particularly invite further hacking)
If you have an idea, feel free to check out the code and implement the new feature. I’m certainly willing to entertain new features or bug-fix requests as well. The code is available in bzr here:
git clone https://github.com/xoviat/profile-viewer.git
cd profile-viewer
pip install -e .
You can contact me directly if you’d like to contribute. Or you can just set up a bzr branch on LaunchPad and request a merge.
Roadmap/Wish-list
This is just a listing of things that either I or others have requested as features:
provide comparison views and “progress” views that compare across multiple profiles
(re)support Hotshot profile dumps (removed because Hotshot itself was deprecated)
support Robert Kern’s line_profiler module (line and import timings)
support IronPython profiles (with cleanup on load to remove “noise” functions)
with a line-profiling module, allow per-line profile views
support (C) calltree/cachegrind files (as used by kcachegrind)
clean up the UI code (very hacky)
configuration/storage of preferences such as column widths, rounded corners, padding, etc.
utility functions for capturing data
Other Tools
RunSnakeRun is by no means a comprehensive tool-set for profiling, you may want to have any or all of these other tools available for your profiling needs:
Gprof2Dot – Converts various Profile formats into dot-format graphs
Robert Kern’s line_profiler – Cython based Python profiler with line timings
KCacheGrind – KDE viewer for CacheGrind C-level profiler or converted Python profiles (via pyprof2calltree), KCacheGrind is basically what RunSnakeRun started off trying to imitate save that RunSnakeRun was intended to be Python specific and cross-platform
profilehooks – specify which function to profile by using a decorator on a particular function
Copyright 2005-2017 Contributors
1 maintainer

Metadata
1 maintainer
Release files for profile-viewer 0.1.5
For a detailed explanation of source distributions (sdists) and built distributions (wheels), please see the package formats documentation.
Source distribution (sdist)
| File | Size | Uploaded | |
|---|---|---|---|
| profile-viewer-0.1.5.tar.gz | 790.9 kB | Details |
Built distribution (wheel)
| File | Interpreter | ABI | Platform | Reset |
|---|---|---|---|---|
| profile_viewer-0.1.5-py3-none-any.whl | Python 3 | none | any | Details |
Total release size: 830.8 kB
Release files / profile-viewer-0.1.5.tar.gz
| Download URL | profile-viewer-0.1.5.tar.gz |
|---|---|
| Size | 790.9 kB |
| Tags | Source |
|
SHA-256 checksum How to use checksums |
d24ab1af7dda1e7e6cdcf53f3c35476bbeeb2613bd23f545535447771d1077cd
|
|
BLAKE2b-256 checksum How to use checksums |
f32e9d65efec60463e39047d4b7ab3b55cbfd963294b4c194290da7f28634e62
|
| Upload date | |
|
Uploaded using Trusted Publishing? What is trusted publishing? |
No |
Release files / profile_viewer-0.1.5-py3-none-any.whl
| Download URL | profile_viewer-0.1.5-py3-none-any.whl |
|---|---|
| Size | 39.9 kB |
| Tags | Python 3 |
|
SHA-256 checksum How to use checksums |
9d7dc707aaf8373b93404e548b09fd61121101ff693f00b3cb06d6e3d73f2beb
|
|
BLAKE2b-256 checksum How to use checksums |
9feaf1ba5f0fcd3815d77e43212fde7bd7da9dda977224064bf210cbd0a33a01
|
| Upload date | |
|
Uploaded using Trusted Publishing? What is trusted publishing? |
No |














