Prometheus Exporter for Intel NCS2 Metrics

Project description
Intel NCS2 Prometheus Exporter


A Prometheus exporter for the Intel Neural Compute Stick 2 (NCS2) / Intel Movidius MyriadX
Quick Start
To directly install prometheus_ncs2_exporter as a DaemonSet into the Kubernetes cluster:
$ kubectl apply -f https://raw.githubusercontent.com/adaptant-labs/prometheus_ncs2_exporter/prometheus-ncs2-exporter.yaml
Pods will be scheduled on any node with a feature.node.kubernetes.io/usb-ff_03e7_2485.present (provided by NFD) or
accelerators/ncs2 (provided by k8s-auto-labeller, in combination with NFD-based discovery) label set. These labels
can also be set manually on NCS2-capable nodes for simple deployments in order to enqueue the Pod.
Usage
prometheus_ncs2_exporter can be run as-is without any additional configuration. A number of configuration and
validation options are provided, but should not need to be used in normal cases. These are explained below:
$ prometheus_ncs2_exporter --help
usage: prometheus_ncs2_exporter [-h] [--ip IP] [--port PORT]
                                [--polling-interval SEC] [--model MODEL]
                                [--instantiate-devices]

Prometheus Exporter for Intel NCS2 Metrics

optional arguments:
  -h, --help              show this help message and exit
  --ip IP                 IP address to bind to (default: 0.0.0.0)
  --port PORT             Port to expose metrics on (default: 8084)
  --polling-interval SEC  Polling interval in seconds (default: 1)
  --model MODEL           XML (IR) model to load (only for validation)
  --instantiate-devices   Instantiate available devices (only for validation)
Metrics
The following metrics are exported:
| Metric | Description |
|---|---|
| ncs2_num_devices | The total number of NCS2 devices |
| ncs2_num_available_devices | The total number of available NCS2 devices |
| ncs2_temperature_celsius | NCS2 device temperature in Celsius (per device) |
Viewed from the exporter:
# TYPE ncs2_num_devices gauge
ncs2_num_devices 1.0
# HELP ncs2_num_available_devices Number of available NCS2 devices
# TYPE ncs2_num_available_devices gauge
ncs2_num_available_devices 1.0
# HELP ncs2_temperature_celsius NCS2 device temperature in Celsius
# TYPE ncs2_temperature_celsius gauge
ncs2_temperature_celsius{name="MYRIAD"} 40.917320251464844
Note: Unfortunately, as the current OpenVINO API does not presently permit querying the DEVICE_THERMAL metric
directly without a model loaded onto the device, the ncs2_temperature_celsius metric will, therefore, return 0°C for
devices that don't presently have a model loaded. Furthermore, applications that are using the NCS2 device directly
may result in the device being flagged as unavailable by the OpenVINO runtime, preventing the main exporter from
being able to enumerate the device or obtain metrics from it. In order to mitigate these issues, the exporter has been
split into two parts:
- The main exporter that provides an overview of NCS2 devices on the system (discoverable/available)
- A device metric exporter to be instantiated within each NCS2-enabled inference application independently
A high-level overview of the expected interactions, metric sources, and integration points is as follows:
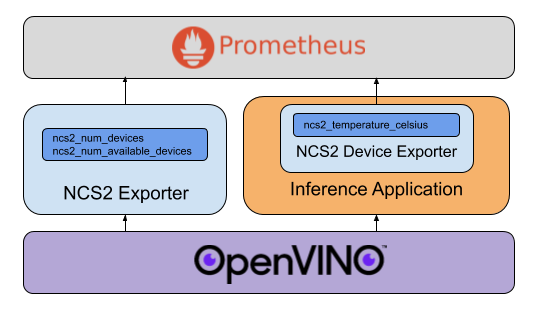
Device Metric Exporter Instantiation in Inference Applications
prometheus_ncs2_exporter exposes a python API that can be used directly by inference applications, and which is
complementary to the OpenVINO Inference Engine Python API. A minimal example is provided below:
from prometheus_ncs2_exporter import NCS2DeviceExporter
from openvino.inference_engine import IECore
from time import sleep

inference_engine = IECore()
net = inference_engine.read_network('model.xml', 'model.bin')
exec_net = inference_engine.load_network(net, 'MYRIAD')

exporter = NCS2DeviceExporter(inference_engine=inference_engine)
exporter.start_http_server()

while True:
    sleep(1)
Note that while start_http_server() will kick off a separate thread from which to serve the device metrics from
(exposed on port 8085 by default), it is non-blocking by default. This is by design, as it permits the inference
application to continue on with its main thread of execution. The thread is run in daemon mode, and will terminate
together with the main thread.
For applications that wish to terminate gracefully, a shutdown() method is provided which can be used by exception
and signal handlers. A more complete example demonstrating this use is provided in inference_example.py
for reference.
Automated Metric Scraping / Kubernetes Pod Annotation
As each application instantiating the device metric exporter will be exposing metrics, Kubernetes Pods should be
annotated with the prometheus.io/scrape: "true" annotation in order to be automatically scraped alongside the main
exporter.
Device Validation with Model Loading
The option to load a model onto each available device is provided for validating the functionality of the exporter, but as this generates work on the device-under-monitoring and, worse, potentially makes a device unavailable to a service that actually needs it, should never be used in production.
Alerting Rules
The stated nominal operating range for the NCS2 is between 0°C and 40°C. While it can still operate at higher temperatures, there is an increased risk of inference failures being produced. Thermal throttling is applied automatically once the internal device temperature reaches 70°C, at which point the USB device will automatically disconnect itself and it will no longer be possible to obtain thermal readings until it cools off and re-attaches.
With these points in mind, sample alerting rules for Prometheus (provided in alerting_rules.yml for convenience) are as follows:
groups:
  - name: ncs2_temp_monitoring
    rules:
      - alert: ncs2_temp_warning
        expr: ncs2_temperature_celsius > 45.0
        labels:
          severity: warning
        annotations:
          summary: "High NCS2 device temperature"
      - alert: ncs2_temp_critical
        expr: ncs2_temperature_celsius > 65.0
        labels:
          severity: critical
        annotations:
          summary: "Critical NCS2 device temperature"
Depending on the deployment, it may be necessary to increase the warning threshold to avoid spurious warnings. It is recommended to monitor the expected upper bounds of the inference workload in real-world deployments and to adjust this accordingly.
Features and bugs
Please file feature requests and bugs in the issue tracker.
Acknowledgements
This project has received funding from the European Union’s Horizon 2020 research and innovation programme under grant agreement No 825480 (SODALITE).
License
prometheus_ncs2_exporter is licensed under the terms of the Apache 2.0 license, the full
version of which can be found in the LICENSE file included in the distribution.
Release history Release notifications | RSS feed


Download files
Download the file for your platform. If you're not sure which to choose, learn more about installing packages.
Source Distribution
Built Distribution
Filter files by name, interpreter, ABI, and platform.
If you're not sure about the file name format, learn more about wheel file names.
Copy a direct link to the current filters
File details
Details for the file prometheus_ncs2_exporter-0.1.0.tar.gz.
File metadata
- Download URL: prometheus_ncs2_exporter-0.1.0.tar.gz
- Upload date:
- Size: 8.0 kB
- Tags: Source
- Uploaded using Trusted Publishing? No
- Uploaded via: twine/3.2.0 pkginfo/1.6.1 requests/2.23.0 setuptools/49.3.1 requests-toolbelt/0.9.1 tqdm/4.52.0 CPython/3.8.6
File hashes
| Algorithm | Hash digest | |
|---|---|---|
| SHA256 |
74a27b404863af21c83b05abf3c02e444fc69b412f327f11ac58afbd1cd18853
|
|
| MD5 |
43562eacf4809711f68290030756dce3
|
|
| BLAKE2b-256 |
a4c0d3b02a60a32267d6a30d0254bc640d0ea8430ec8bb6aca28470abcbf4579
|
File details
Details for the file prometheus_ncs2_exporter-0.1.0-py3-none-any.whl.
File metadata
- Download URL: prometheus_ncs2_exporter-0.1.0-py3-none-any.whl
- Upload date:
- Size: 11.6 kB
- Tags: Python 3
- Uploaded using Trusted Publishing? No
- Uploaded via: twine/3.2.0 pkginfo/1.6.1 requests/2.23.0 setuptools/49.3.1 requests-toolbelt/0.9.1 tqdm/4.52.0 CPython/3.8.6
File hashes
| Algorithm | Hash digest | |
|---|---|---|
| SHA256 |
56570535c7b0af383dfe71be6357ce9bf603565a8f308d1c0c85a6778733ee5b
|
|
| MD5 |
1102599773f228e23874148ce9cc4133
|
|
| BLAKE2b-256 |
c10ed2c668251e2c018099468eb8bbb00cbe7252f6059863a47c295587ee23b0
|


