The Python Data Valuation Library


Project description

A library for data valuation.


pyDVL collects algorithms for Data Valuation and Influence Function computation. Here is the list of all methods implemented.
Data Valuation for machine learning is the task of assigning a scalar to each element of a training set which reflects its contribution to the final performance or outcome of some model trained on it. Some concepts of value depend on a specific model of interest, while others are model-agnostic. pyDVL focuses on model-dependent methods.

Comparison of different data valuation methods on best sample removal.
The Influence Function is an infinitesimal measure of the effect that single training points have over the parameters of a model, or any function thereof. In particular, in machine learning they are also used to compute the effect of training samples over individual test points.
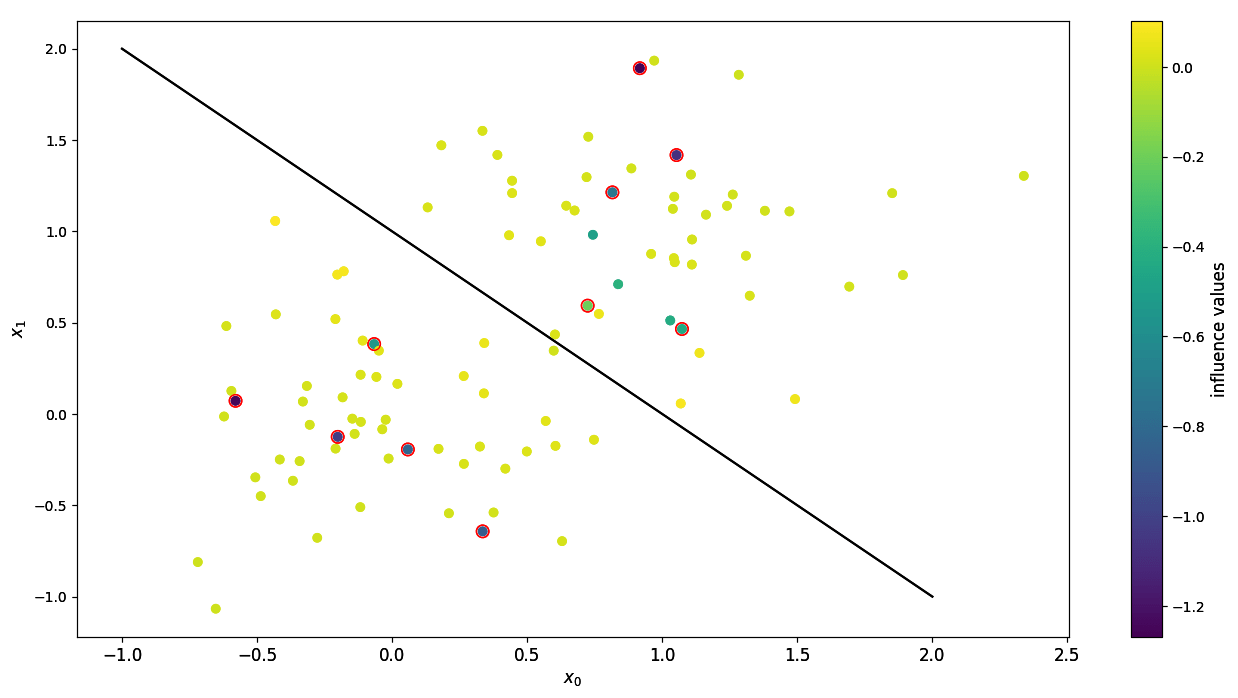
Influences of input points with corrupted data. Highlighted points have flipped labels.
Installation
To install the latest release use:
$ pip install pyDVL
You can also install the latest development version from TestPyPI:
pip install pyDVL --index-url https://test.pypi.org/simple/
pyDVL has also extra dependencies for certain functionalities, e.g. for using influence functions run
$ pip install pyDVL[influence]
For more instructions and information refer to Installing pyDVL in the documentation.
Usage
Please read Getting Started in the documentation for more instructions. We provide several examples for data valuation and for influence functions in our Example Gallery.
Influence Functions
- Import the necessary packages (the exact ones depend on your specific use case).
- Create PyTorch data loaders for your train and test splits.
- Instantiate your neural network model and define your loss function.
- Instantiate an
InfluenceFunctionModeland fit it to the training data - For small input data, you can call the
influences()method on the fitted instance. The result is a tensor of shape(training samples, test samples)that contains at index(i, j) the influence of training sampleion test samplej. - For larger datasets, wrap the model into a "calculator" and call methods on it. This splits the computation into smaller chunks and allows for lazy evaluation and out-of-core computation.
The higher the absolute value of the influence of a training sample on a test sample, the more influential it is for the chosen test sample, model and data loaders. The sign of the influence determines whether it is useful (positive) or harmful (negative).
Note pyDVL currently only support PyTorch for Influence Functions. We plan to add support for Jax next.
import torch
from torch import nn
from torch.utils.data import DataLoader, TensorDataset

from pydvl.influence import SequentialInfluenceCalculator
from pydvl.influence.torch import DirectInfluence
from pydvl.influence.torch.util import (
   NestedTorchCatAggregator,
   TorchNumpyConverter,
   )

input_dim = (5, 5, 5)
output_dim = 3
train_x, train_y = torch.rand((10, *input_dim)), torch.rand((10, output_dim))
test_x, test_y = torch.rand((5, *input_dim)), torch.rand((5, output_dim))
train_data_loader = DataLoader(TensorDataset(train_x, train_y), batch_size=2)
test_data_loader = DataLoader(TensorDataset(test_x, test_y), batch_size=1)
model = nn.Sequential(
  nn.Conv2d(in_channels=5, out_channels=3, kernel_size=3),
  nn.Flatten(),
  nn.Linear(27, 3),
  )
loss = nn.MSELoss()

infl_model = DirectInfluence(model, loss, hessian_regularization=0.01)
infl_model = infl_model.fit(train_data_loader)

# For small datasets, instantiate the full influence matrix:
influences = infl_model.influences(test_x, test_y, train_x, train_y)

# For larger datasets, use the Influence calculators:
infl_calc = SequentialInfluenceCalculator(infl_model)

# Lazy object providing arrays batch-wise in a sequential manner
lazy_influences = infl_calc.influences(test_data_loader, train_data_loader)

# Trigger computation and pull results to memory
influences = lazy_influences.compute(aggregator=NestedTorchCatAggregator())

# Trigger computation and write results batch-wise to disk
lazy_influences.to_zarr("influences_result", TorchNumpyConverter())
Data Valuation
The steps required to compute data values for your samples are:
- Import the necessary packages (the exact ones will depend on your specific
use case, but most of the interface is exposed through
pydvl.valuation). - Create two
Datasetobjects with your train and test splits. There are some factories to do this from arrays or scikit-learn toy datasets. - Create an instance of a
SupervisedScorer, with any sklearn scorer and a "valuation set" over which your model will be scored. - Wrap model and scorer in a
ModelUtility. - Use one of the methods defined in the library to compute the values. In the example below, we use the most basic Montecarlo Shapley with uniform sampling, an approximate method for computing Data Shapley values.
- Call
fitin a joblib parallel context. The result is a variable of typeValuationResultthat contains the indices and their values as well as other attributes. This object can be sliced, sorted and inspected directly, or you can convert it to a dataframe for convenience.
The higher the value for an index, the more important it is for the chosen model, dataset and scorer. Reciprocally, low-value points could be mislabelled, or out-of-distribution, and dropping them can improve the model's performance.
from joblib import parallel_config
from sklearn.datasets import load_iris
from sklearn.svm import SVC
from pydvl.valuation import Dataset, ShapleyValuation, UniformSampler,\
    MinUpdates, ModelUtility, SupervisedScorer

seed = 42
model = SVC(kernel="linear", probability=True, random_state=seed)

train, val = Dataset.from_sklearn(load_iris(), train_size=0.6, random_state=24)
scorer = SupervisedScorer(model, val, default=0.0)
utility = ModelUtility(model, scorer)
sampler = UniformSampler(batch_size=2 ** 6, seed=seed)
stopping = MinUpdates(1000)
valuation = ShapleyValuation(utility, sampler, stopping, progress=True)

with parallel_config(n_jobs=32):
    valuation.fit(train)

result = valuation.result
Deprecation notice
Up until v0.9.2 valuation methods were available through the pydvl.value
module, which is now deprecated in favour of the design showcased above,
available under pydvl.valuation. The old module will be removed in a future
release.
Contributing
Please open new issues for bugs, feature requests and extensions. You can read about the structure of the project, the toolchain and workflow in the guide for contributions.
License
pyDVL is distributed under LGPL-3.0. A complete version can be found in two files: here and here.
All contributions will be distributed under this license.
Release history Release notifications | RSS feed


Download files
Download the file for your platform. If you're not sure which to choose, learn more about installing packages.
Source Distribution
Built Distribution
Filter files by name, interpreter, ABI, and platform.
If you're not sure about the file name format, learn more about wheel file names.
Copy a direct link to the current filters
File details
Details for the file pydvl-0.10.0.tar.gz.
File metadata
- Download URL: pydvl-0.10.0.tar.gz
- Upload date:
- Size: 307.0 kB
- Tags: Source
- Uploaded using Trusted Publishing? No
- Uploaded via: twine/6.1.0 CPython/3.9.21
File hashes
| Algorithm | Hash digest | |
|---|---|---|
| SHA256 |
be25573aa50bc826e80fd8e499c8d45e4141294ef24ae37bf2efe40089ccb3fa
|
|
| MD5 |
5b4f0b6bf390e20b704001f7cd7226c8
|
|
| BLAKE2b-256 |
c0312d52d0bd1f39a14a3ace92d3350d98ea8374a1bdd329e450d665acd379d5
|
File details
Details for the file pyDVL-0.10.0-py3-none-any.whl.
File metadata
- Download URL: pyDVL-0.10.0-py3-none-any.whl
- Upload date:
- Size: 373.1 kB
- Tags: Python 3
- Uploaded using Trusted Publishing? No
- Uploaded via: twine/6.1.0 CPython/3.9.21
File hashes
| Algorithm | Hash digest | |
|---|---|---|
| SHA256 |
ba1d277b6c91e88f9e69edaa434678d9c46052f0d5acc7d4fd7d79b9cf26c2cf
|
|
| MD5 |
fe4d9e3c61b935e4f0099c6504b0b763
|
|
| BLAKE2b-256 |
dc762e3f7455068cc30ac31777569d1bbffa64e668207ee07f807c6c00974740
|


