Python API for Cyber Attack and Network Vulnerability Assessment Software for Smartgrid

Project description
PyCanvass is an open source simulation software for computing resiliency of Smart Grid and power systems critical infrastructure. It has a unique resiliency computation engine, and it enables integration with other industry-standard power system simulation software like GridLAB-D, and Real-Time Digital Simulators.
PyCanvass was developed by Sayonsom Chanda, at Washington State University - and is still maintained by him. If you have any questions, or find bugs - please email: sayon@ieee.org
Typical Use-Cases
Easy power system modeling – you can use it to quickly build GridLAB-D Models.
Data-driven Disaster response design (through reconfiguration algorithms)
Cyber-physical power grid simulations
Resource optimization during extreme events
Resiliency computation (also, design your own resiliency metric)
Connect with digital real-time simulators, like RTDS, Opal-RT.
Simulate cyber attacks for education/research purposes
Installation
Using pip
These installations are stable and well-supported. The most preferred way of installing PyCanvass is using pip:
pip install pycanvassIf you have previously installed PyCanvass, it is recommended to frequently
pip uninstall pycanvass
pip install --upgrade pycanvass
Build Your Own
These installations have the freshest code, but it may contain bugs. Please follow the steps:
Download this repository as a Zip file.
Extract it to a location of your choice.
Change directory to the folder in Command Prompt, and run
python setup.py installAssumes you have Python installed and already set to your path.
Simulation of unfavorable events and risk estimation of power system infrastructure
Tropical Storm
In an imaginary simple distribution system that has 8 loads downstream of a substation, and is faced with sustained wind gusts of 97 mph, and anticipates upto 10 ft of water logging - what’s the risk to the power grid infrastructure?
With 4 lines of code, PyCanvass can help solve these kinds of problem.
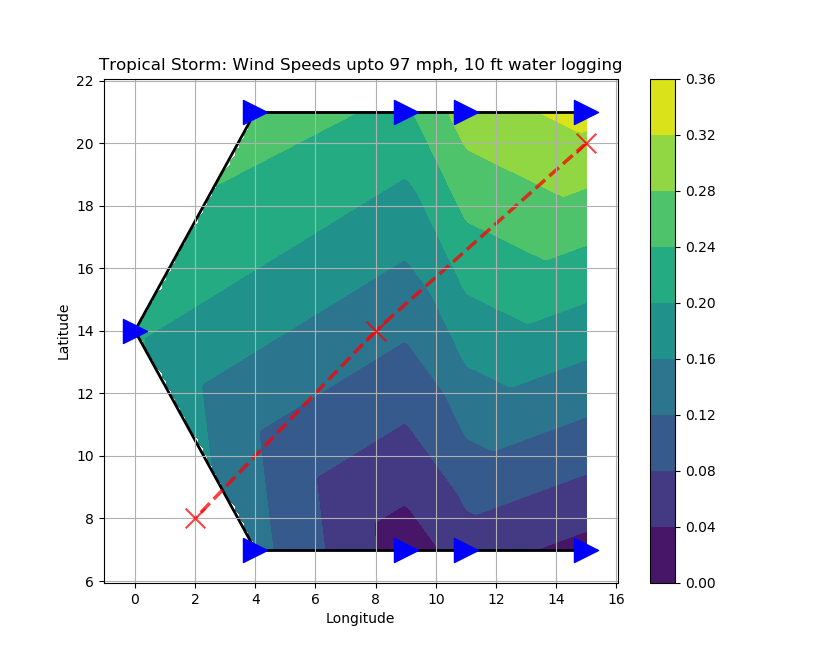
The data set is available in the ‘demo_data’ folder. The code to obtain the above results is:
from pycanvass.all import *
project, nodes, edges = load_project()
network = build_network(nodes,edges)
mygraph = network["normal"]
node_risk_calculation(mygraph, title="Tropical Storm: Wind Speeds upto 97 mph, 10 ft water logging")
Getting Started Guide
[Full documentation is coming soon]
Your first pyCanvass program
We try to make this library accessible to non-programmers, programming beginners, non-power engineers, as well as the most hardened software-professionals. Feel free to read in detail of each step, or skip - as appropriate for your skill-level.
Make sure you have the latest versions of pyCanvass, Python, and GridLAB-D installed correctly.
Create a new folder, and inside that include a user_preferences.json file, and project_config.json file. Examples of these are in the demo-data.
Also download the example node-file.csv, node-file.csv, and threat-file.csv - and keep them in the same folder.
Using any text editor (like Notepad++ or VS Code or Sublime Text), open the project_config.json file.
Edit the data section of the project_config file, replacing the paths mentioned in the nodes, edges, and threat section of the file with the file path of where you just placed the node-file.csv, edge-file.csv, and threat-file.csv.
In your text editor, open a new file and save as “mymodel.py”
In mymodel.py, write:
from pycanvass.all import *
project, nodes, edges = load_project()
Now you are ready to perform network Vulnerability analysis. If you want to find the least risk path, i.e. the most resilient path, from a node, say F1_2 in the node-file.csv in the sample to another node, F2_3, just add the following code to your program above:
paths = path_search(mygraph, 'F1_2', 'F2_3', criterion="least_risk")
print(paths)
Citation
If you use PyCanvass in your simulations, please cite the library in your work. The citation helps other researchers who are not familiar with PyCanvass to easily reproduce results of your work, thus increasing the credibility and re-usability of your work. Also, we will soon release a website that features different papers that have used PyCanvass. Please let us know so that we can help increase the visibility of your work by featuring it on our website.
IEEE:
S. Chanda, A. Srivastava, R. Hovsapian, "pycanvass: an Open Source Cyber-Attack and Network Vulnerability Assessment Tool for Resiliency Analysis of Distribution Systems", IEEE Trans. Smart Grid (to be submitted)Resources
Videos
Community Contribution
There are many ways you help us.
If you find some errors and bugs, please let us know.
Submit feature requests
Submit pull requests with your own additions and contributions.
Contact Us
Email: sayon@ieee.org
Release history Release notifications | RSS feed


Download files
Download the file for your platform. If you're not sure which to choose, learn more about installing packages.
Source Distribution
File details
Details for the file pycanvass-0.0.2.23.tar.gz.
File metadata
- Download URL: pycanvass-0.0.2.23.tar.gz
- Upload date:
- Size: 47.1 kB
- Tags: Source
- Uploaded using Trusted Publishing? No
- Uploaded via: Python-urllib/3.6
File hashes
| Algorithm | Hash digest | |
|---|---|---|
| SHA256 |
9e1c1221c89eb8e9149a893becccd229f91b2f0df9ae3788a8412eac978bf7ae
|
|
| MD5 |
a9c01da17e1074926bdaafdce449ee77
|
|
| BLAKE2b-256 |
433b07d3a4310b200b6449f9992cfc1e2ae14c06130bbde93eaa69503e181abf
|


